


Exploring supply chain data on Bloomberg and Workspace
02/10/2025

Have you ever wondered where to start researching a company’s customer and supplier relationships? Well, wonder no longer.
Bloomberg
In Bloomberg there is a whole section devoted to supply chain data. If you’re new to Bloomberg, we would advise booking some introductory training with a librarian – or at least reading our post on Bloomberg basics before you set up your account.
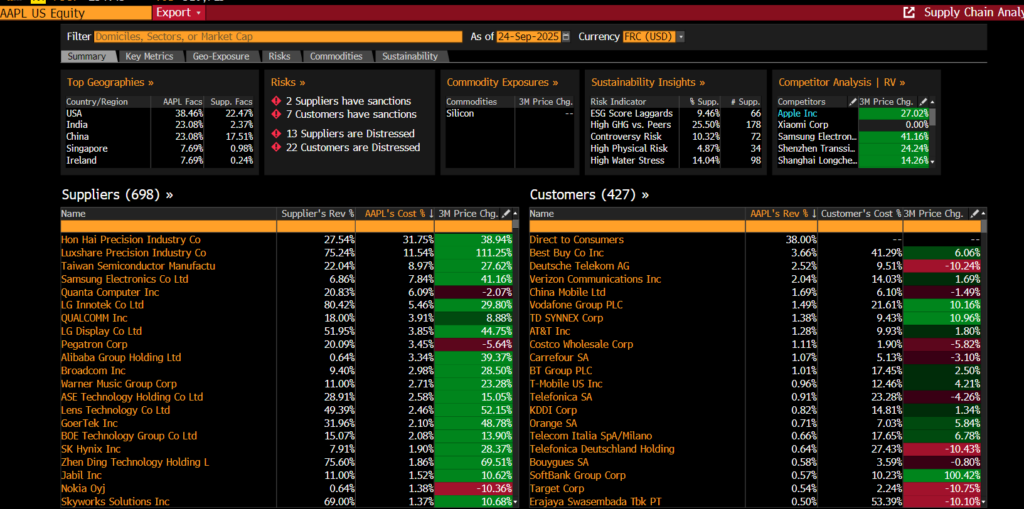
To access supply chain data, use Bloomberg’s Supply Chain Analysis (SPLC) function, <SPLC>. Either type the code into any company screen and click on <GO> or, more experienced Bloomberg users can combine this into a search, e.g. <SPLC AAPL US> <GO> to get the supply chain analysis for Apple, Inc.
The SPLC function aims to provide a “comprehensive supply chain breakdown for a selected company”. Users can analyse revenue exposure for the central company, its suppliers, and its customers, as well as track the company’s geographic, commodity, sustainability, and risk exposures. It focuses on “actual business relationships” and helps to show the money flows between companies.
The SPLC Summary screen displays a company’s suppliers and customers along with the amount of business they represent:
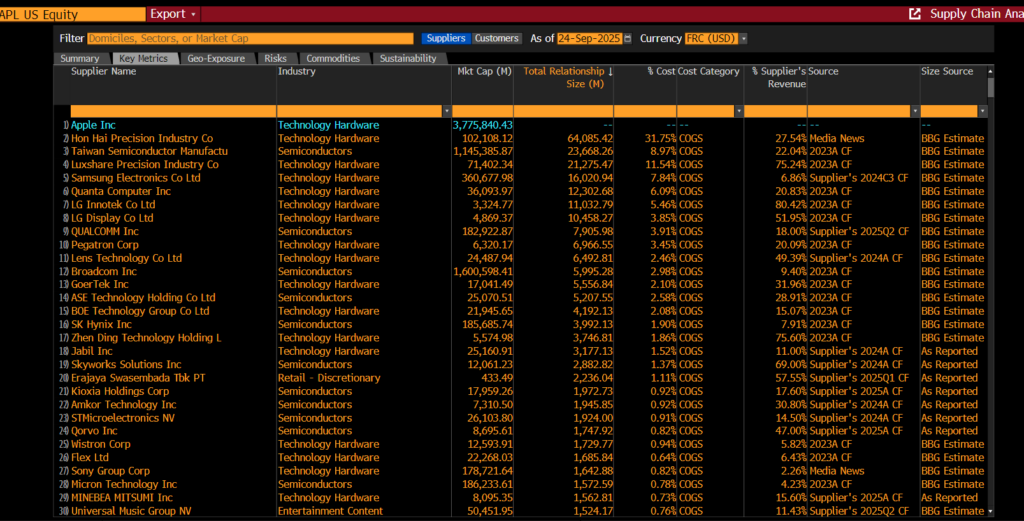
The ‘Key Metrics’ tab provides a sortable and filterable table of supplier or customer data so you can dig into relationship details:
To break down the company’s exposures by different criteria, select a tab:
- Summary: See all suppliers or customers along with the amount of business they represent.
- Key Metrics: Review all suppliers or customers in a filterable table view.
- Geo-Exposure: Break down companies by the geographic location of their domicile or factories.
- Risks: Gauge risks to supply chain or revenue by understanding default risk, consensus growth expectations, and sanctions exposure for key counterparties.
- Commodities: Assess publicly disclosed exposures to key materials
- Sustainability: Review related companies’ sustainability insights
Workspace
Workspace also provides supply chain data for companies via its Value Chain app. It aims to show the relationships a company has with its suppliers and customers.
If you have never used Workspace before, you can register for an account using these instructions, then we recommend that you read our post on Getting started with Workspace for a quick introduction. If you already have a Workspace account you can access it online here.
To access the Value Chain for a company, open any company overview, for example Meta Platforms Inc. (Facebook). Go to the ‘Peers & Valuations’ tab and select ‘Value Chains’ (or simply type VChain in the search box at the top left hand corner of the screen).
Several types of Views are available – including grid / industry breakdown /geographic breakdown. Choose the one that meets your needs.
In the following grid view for Meta, the suppliers and customers are shown with information on where they are based, what type of company they are and a confidence score (“Ranging from 0 to 100%, this score indicates how confident we are that the supplier-customer relationship is valid.”). Revenue and implied rating is also available.
Data values can also be exported to Excel for further analysis.
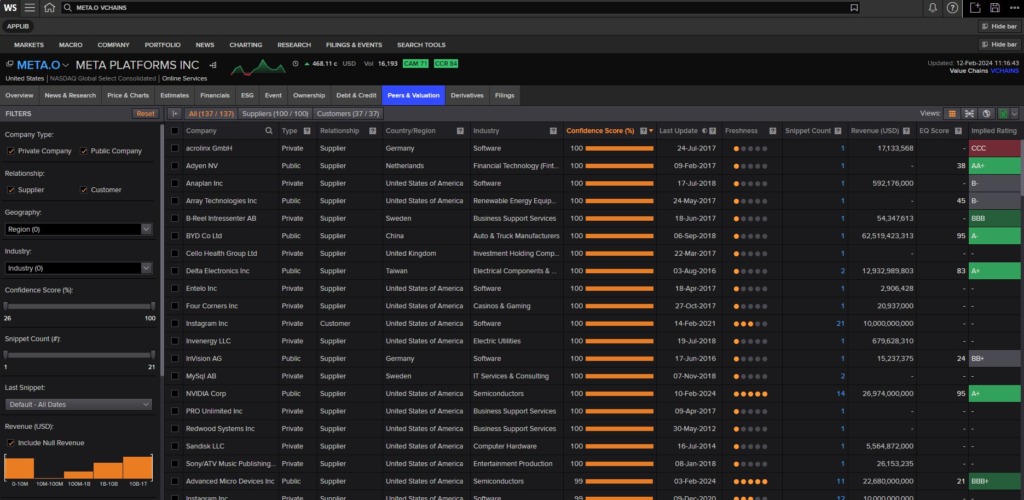
Workspace (2024) Meta Platforms (Facebook) Inc Value Chain grid
Click on the Industry Breakdown icon in ‘Views’ at the top right of the screen (hover over an icon to identify it). This shows the suppliers and customers by broad industry areas. Clicking on the individual industry name will display individual company names.
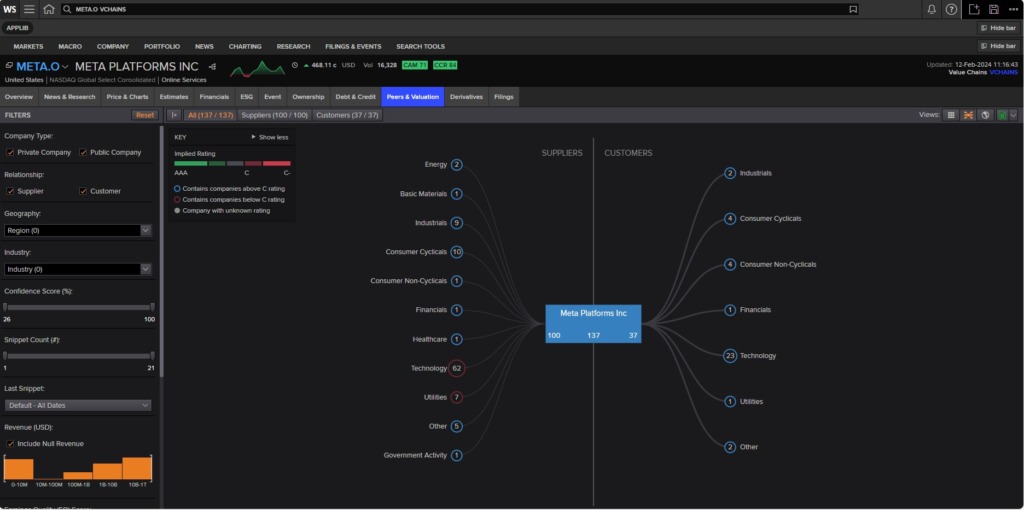
Workspace (2024) Meta Value Chain Industry view
Want to find out more about these resources? Please contact the Library.
Feature image from Pixabay. Available at: https://cdn.pixabay.com/photo/2016/11/27/21/42/stock-1863880_960_720.jpg
Categories & Tags:
Leave a comment on this post:
You might also like…

Library services over Easter, 3-6 April
Kings Norton Library will remain open for study 24/7. You will need your University ID card to enter the building and can use the self-service machines to borrow and return items as usual. Barrington Library ...

How do I access the full-text of Harvard Business Review (HBR)?
This is a frequently asked question, and it's worth knowing how to access this key management journal. So, how do you access HBR in full-text? The short answer is via our eJournals finder. You can find ...

Engineering problem to solve? Let Knovel help you find a solution
Did you know that Knovel provides you with more than just eBooks? Knovel is a key database for many engineering, mechanical and materials courses here at Cranfield University, and contains content from an extensive range ...

What happens when female scholars meet influential leaders?
On the 5 March 2026, our British Council Women in STEM Scholars had the privilege of sitting down with two excellent role models of industry and academia: Professor Dame Karen Holford, ...

From MSc to CEO: Igniting a research revolution
For many, a master’s degree is achieving a big milestone. Kilyan Ocampo, Computational Fluid Dynamics alumni shares how studying at Cranfield helped launch his career in the energy sector. Today, Kilyan ...

Commuting, collaborating and growing: My first term experience at Cranfield
My first term at Cranfield University has been an extremely positive and rewarding experience. While the course has been intense at times, it has pushed me in the best possible way and allowed me ...