


Introducing… BMI from FitchSolutions
13/06/2024
")
BMI, from FitchSolutions, (previously FitchConnect), is one of our favourite resources for industry and country data and analysis.
Industry and sector reports
To access the industry and sector research, you can use the navigation bar in the centre of the page. Click on ‘Service/Industry’ and you will see a dropdown menu of industry headings.
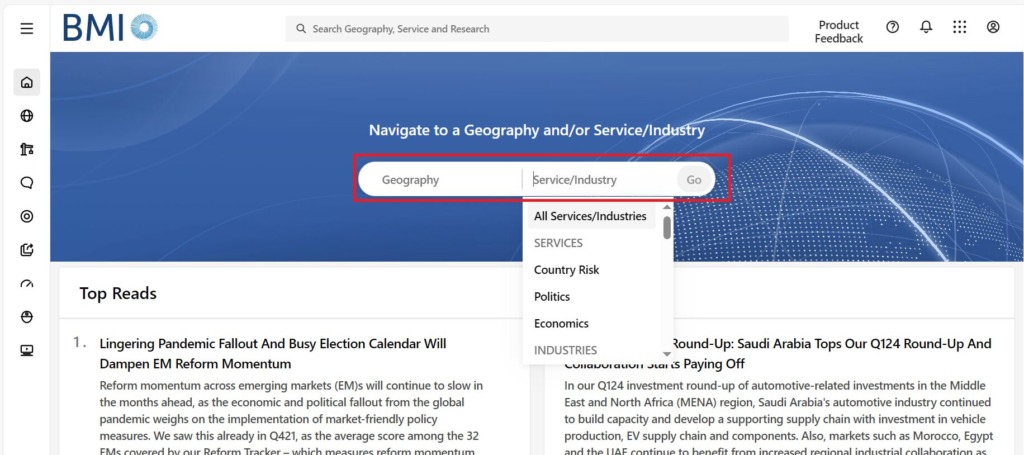
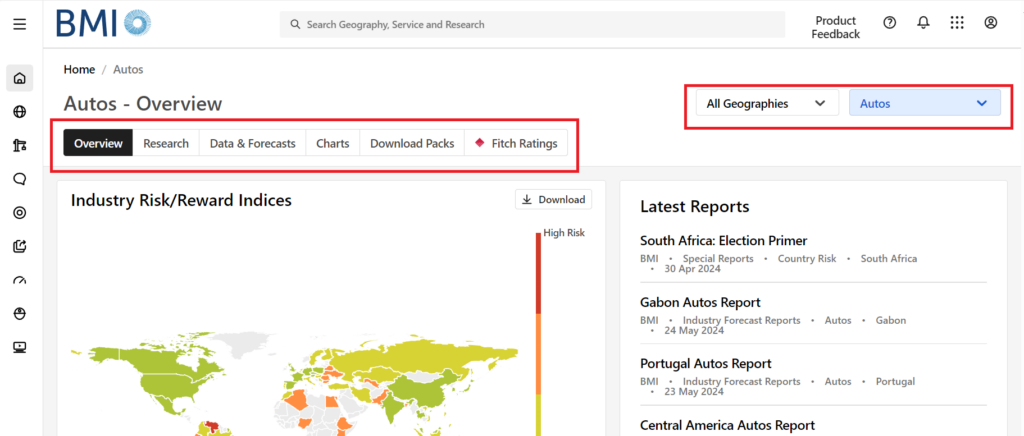
Choose your industry, click on ‘Go’ and you will arrive at that industry’s ‘Overview’ page. Here you can see some charts/pictograms and a list of the latest reports. You can use the tabs to look in more detail at:
- Research information – downloadable as PDFs
- Data & Forecasts – downloadable to Excel
- Charts – you can download the background data to Excel, but not the charts themselves which you can screenshot if you want to
- Download packs containing 10 years historic and 10 years forecast data – downloadable to Excel
You can quickly move to other geographies or industries using the menus near the top, on the right hand side of the screen.
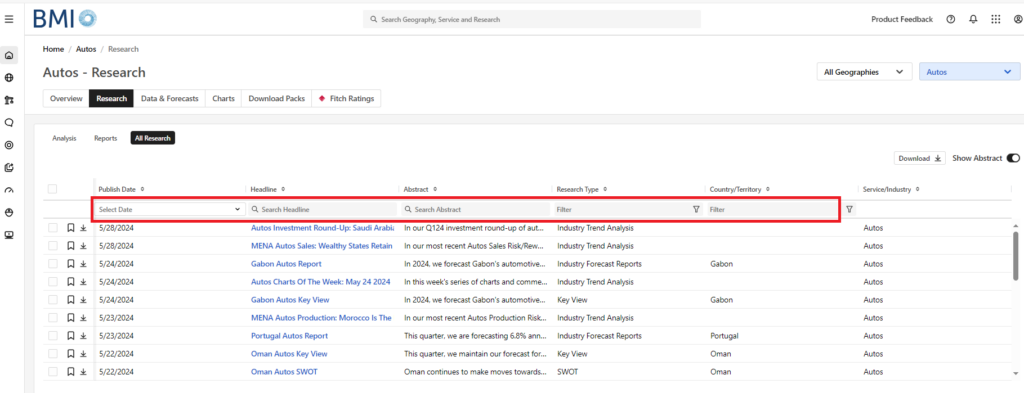
If you choose the Research tab you have the option of viewing Analysis or Reports, but if you want to search an analysis/report headline or abstract, click on All Research. The research is presented in a table and using the top row of the table, you can filter and/or add search terms.
Country risk reports
Country risk reports can be accessed in a similar way to industry content. Use the navigation bar in the centre of the home page, this time clicking on ‘Geography’, and select your country/area from the dropdown menu. Then click on ‘Service/Industry’ and pick ‘Country Risk’ from the Services area of the dropdown menu. You will arrive at the Overview page and have the same set of tabs as the Industry reports, with the addition of a Risk Indices tab, which gives risk-related data downloadable to Excel.
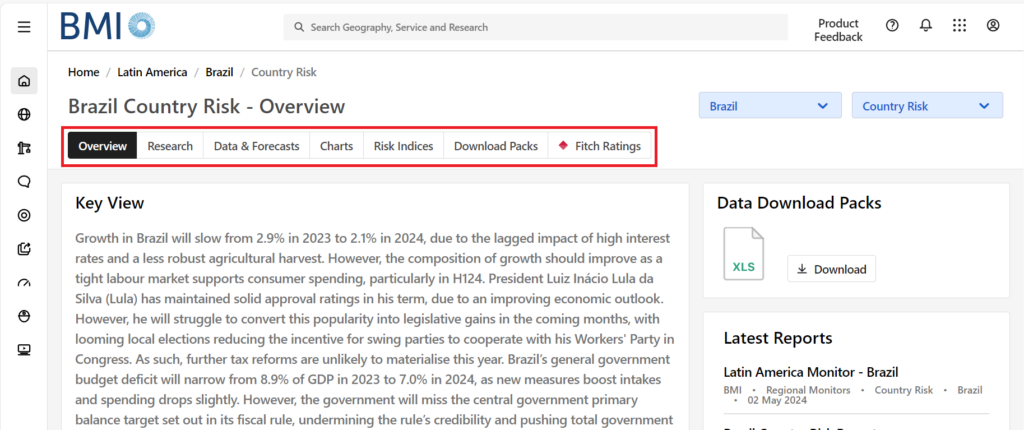
Other features highlighted in the industry and sectors report section above, are available here too. You can quickly move to other geographies or industries using the dropdown menus near the top on the right hand side of the screen, or use the All Research button under the Research tab to enable a more in-depth search of the Research available.
Note that there is a new-for-2024 BMI country report offering of Political Risk information, which you can choose from the Services dropdown menu.
Data and forecasts
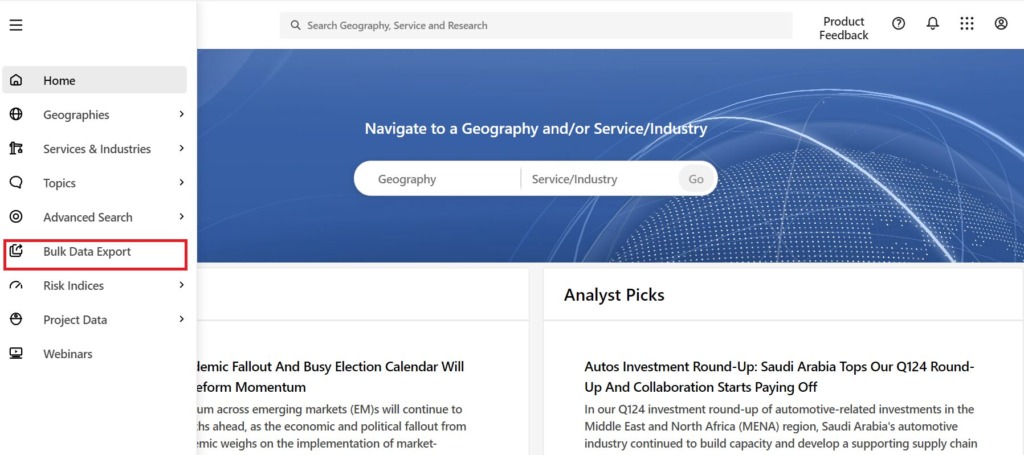
If your country or industry research is data-driven, head straight to the ‘Bulk Data Export’ area which you can pick off the menu on the left of the page. Here there are instructions to source the data you require.
For step-by-steps instructions on using the Bulk Data Export tool, read our post here on Sourcing industry and economic data in BMI.
If you want more detailed guidance on BMI coverage and searching, see the BMI User Guide.
If you have any questions on the BMI service or on any of the data and reports this service includes, please contact the Library.
All images courtesy of FitchSolutions.
Categories & Tags:
Leave a comment on this post:
You might also like…

Using AI tools for your literature review
There are a proliferation of AI tools that can help you organise your life, work and study. This post focuses on academic or scholarly tools that have been developed to enhance the literature searching process, whether for independent research, an assignment or thesis. Bear in mind that these predominantly relate to finding journal/research papers, and not technical, business or trade sources such as standards, market research, industry reports or financial data. So ...

Finding successful past Cranfield theses
It’s always a good idea to look at examples of theses before you start work on your own. You may find them valuable for reading previous research, and for looking at structure, style and methodology. ...

On‑campus or off‑campus? How Cranfield students found their home away from home
Finding the right place to live is one of the biggest decisions you’ll make as you begin your student journey. Whether you’re looking for the convenience and community of living on-campus or the independence ...

Avoiding common referencing errors
As librarians, we get to see the full spectrum of reference lists in student work —from exemplary to … well, let’s just say, works still very much in progress! We are experts in spotting mistakes ...

Using your Mendeley library after you have left Cranfield
So you have spent the whole year (or more) lovingly collecting references around the topics that matter to you and now you have a large, personalised library in Mendeley Reference Manager containing all that information. ...

Referencing the use of generative AI in your work
We recognise that Artificial Intelligence (AI) has, and will increasingly, become a part of our everyday lives and that we need to adapt to it. Hopefully you will have already seen the guidance for staff ...