


Media Reporting & Kindergarten Statistics
22/07/2019

The BBC reported this problem less than a week ago
It dished up the usual typical fayre of poor analysis of the available data.
When you put the data (which is published yearly back to 1996) into useful software, you get the sChart below. The data is in blue. The statistically calculated trended averages are the green lines. The upper and lower performance guidelines (outlining the performance corridor) are the red lines. The dotted red and green lines are the predictions of the performance corridor going forwards.
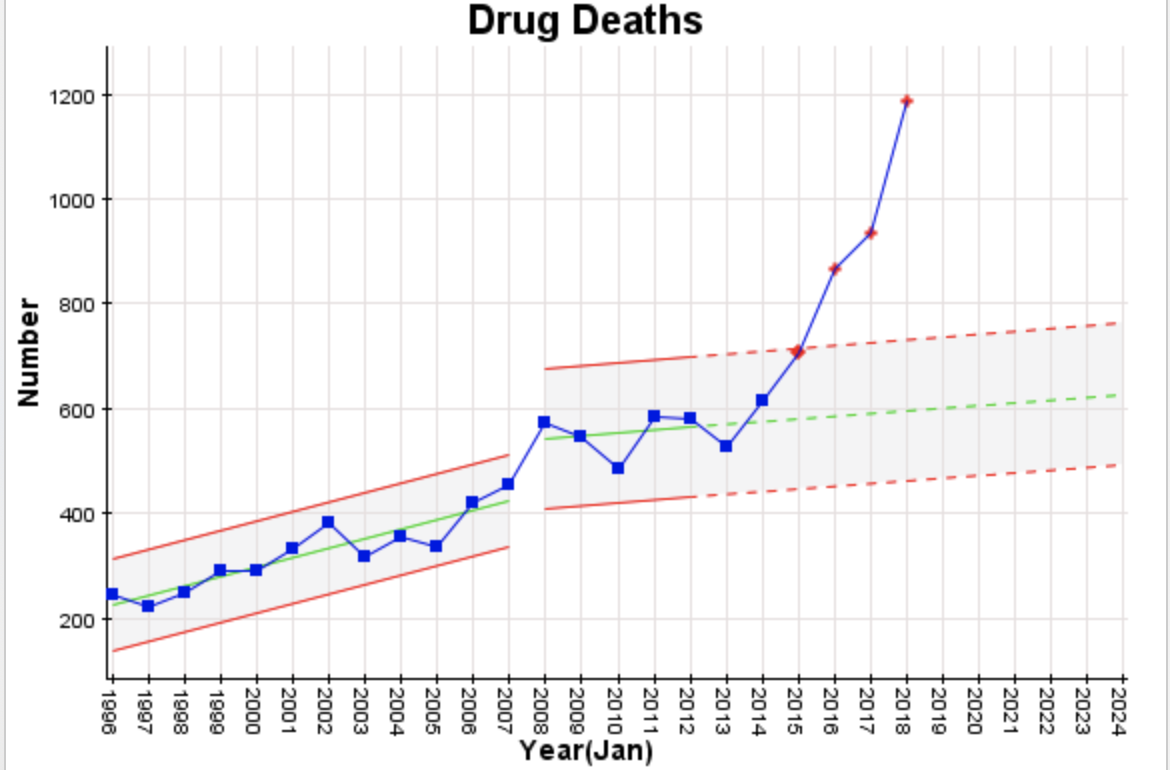
The problem started who knows how long ago with an increasing trend (of around 18 deaths per year) being set from 1996 (when we first have available data). In 2008, there was an upshift of almost 100 deaths per year but with a much reduced trend (5 – 6 per year) upwards. The first thing that comes to mind to cause the shift and the reduced trend, is the change in Scotland’s approach to drugs – see https://www.gov.scot/publications/road-recovery-new-approach-tackling-scotlands-drug-problem/pages/6/
But there could be other causes.
Things turned really nasty, though, from 2015 / 2016 onwards – so getting excited now is at least 3 – 4 years too late. Looking at the media comments / articles on this over the years it seems each year there’s noise and poor analysis about increasing drug deaths, and no preventative action, or if there is action being taken, it’s not working or possibly making things worse!
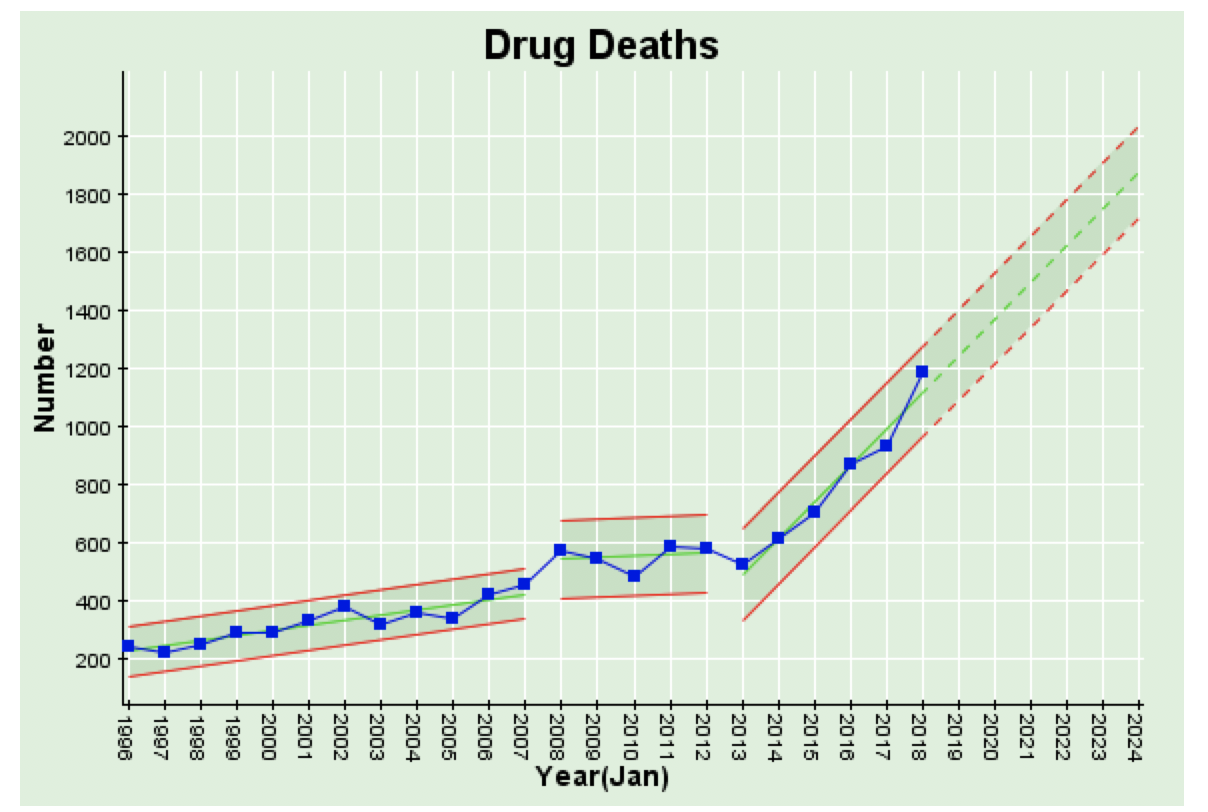
If we project the latest trend forwards by 5 years we see an increasing trend now of 126 per year! So if you think 1,200 is bad now, wait 2024 when it will be almost 2,000 per year!
To help Scotland get to the bottom of this, we might want to start with straightening out the way the BBC reports data and statistics! And let’s not wait until 2024!
Categories & Tags:
Leave a comment on this post:
You might also like…

Finding successful past Cranfield theses
It’s always a good idea to look at examples of theses before you start work on your own. You may find them valuable for reading previous research, and for looking at structure, style and methodology. ...

On‑campus or off‑campus? How Cranfield students found their home away from home
Finding the right place to live is one of the biggest decisions you’ll make as you begin your student journey. Whether you’re looking for the convenience and community of living on-campus or the independence ...

Avoiding common referencing errors
As librarians, we get to see the full spectrum of reference lists in student work —from exemplary to … well, let’s just say, works still very much in progress! We are experts in spotting mistakes ...

Using your Mendeley library after you have left Cranfield
So you have spent the whole year (or more) lovingly collecting references around the topics that matter to you and now you have a large, personalised library in Mendeley Reference Manager containing all that information. ...

Referencing the use of generative AI in your work
We recognise that Artificial Intelligence (AI) has, and will increasingly, become a part of our everyday lives and that we need to adapt to it. Hopefully you will have already seen the guidance for staff ...

Finding part-time work whilst studying at Cranfield – is it right for you?
We know that the cost of living in the UK is a real and ongoing challenge for many students. Whether you are still considering postgraduate study or already preparing for life at university, you ...