


Running a peer analysis in Fame
06/02/2025

If you need to compare a UK company’s financial performance against that of other companies, Fame is a great place to start. This database contains the financial accounts of over 8.5 million public and private companies in the UK and Ireland.
Fame offers two useful functions for making a peer comparison – peer comparison and peer analysis. Here we explain the differences between them and how to use them.
Peer Comparison
For this comparison, you will need to have a company in which you are interested. This function uses pre-defined database information to create a peer group, based on your company. It is a quick and easy comparison method.
- Search for your company, then choose ’Peer comparison’ from the left-hand menu. This instantly finds the 10 closest companies to your company in terms of size and industry code (UK SIC).
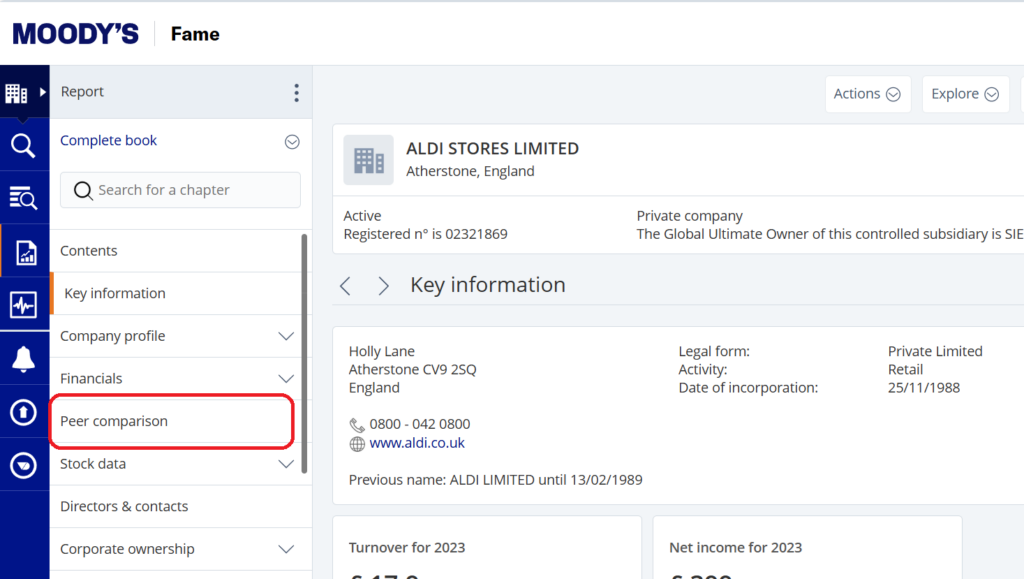
- If 10 companies don’t appear this might be because the company has more recent accounts filed than its peers. In this case, select ‘Own Peer Group’ and change the year in the last box. There are other variables you can change here too.
- In the table, grey columns show rankings within the peer group.
If, having tried it, the peer group composition is not what you expected, use Peer Analysis to create your own peer group.
Peer Analysis
Here you can build a report to benchmark a custom group of companies against each other, so you can make it specific to your requirements – but it needs a bit more work from you.
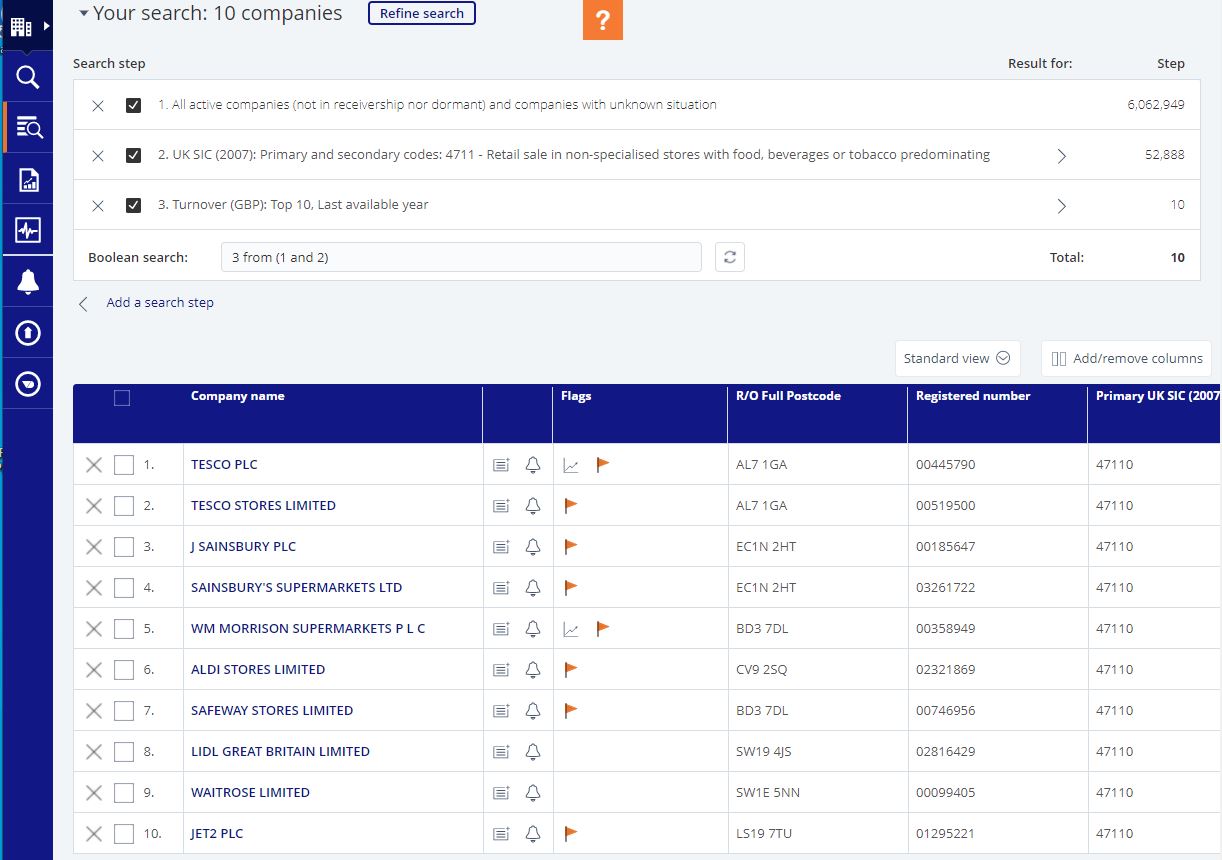
First, select the companies you want to compare. For this example, we’ll look at UK supermarkets.
-
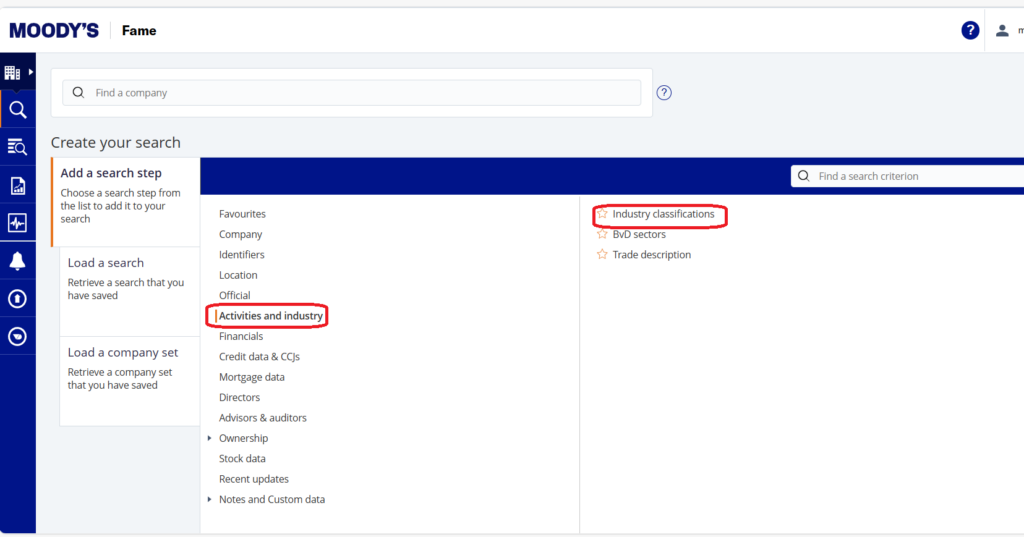
Search by industry classifications:
- From the home page, choose ‘Activities & Industry’ from the ‘search step’ menu.
- Pick ‘Industry classifications’ from the righthand menu.
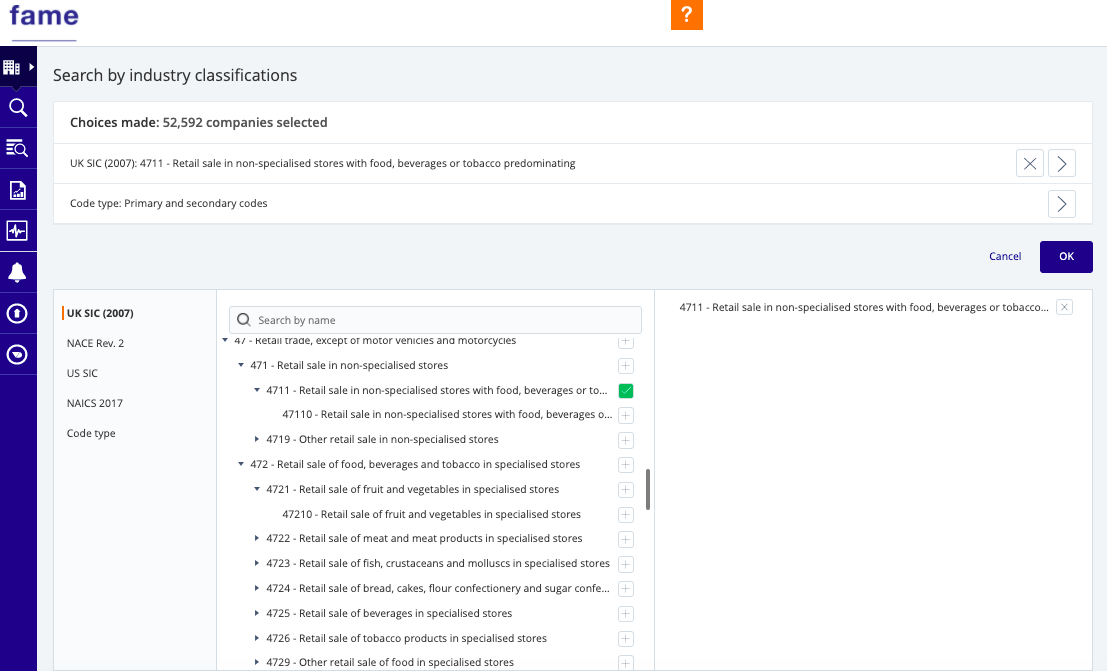
- If you know the SIC code you can search using that, so I know that the UK SIC code for ‘Retail sales in non-specialist stores with food, beverages or tobacco predominating’ is 4711.
- Click the + sign to add the SIC code to your search. It will appear on the right-hand side of your screen.
- If you don’t know the SIC code, you can search by industry name in the search box but be aware you’ll need the correct terminology e.g. it won’t find ‘supermarket’ but will find ‘retail’. You can also browse by using the left-hand arrows to view sub-headings.
- Click OK to return to the search screen.
2. Add filters:
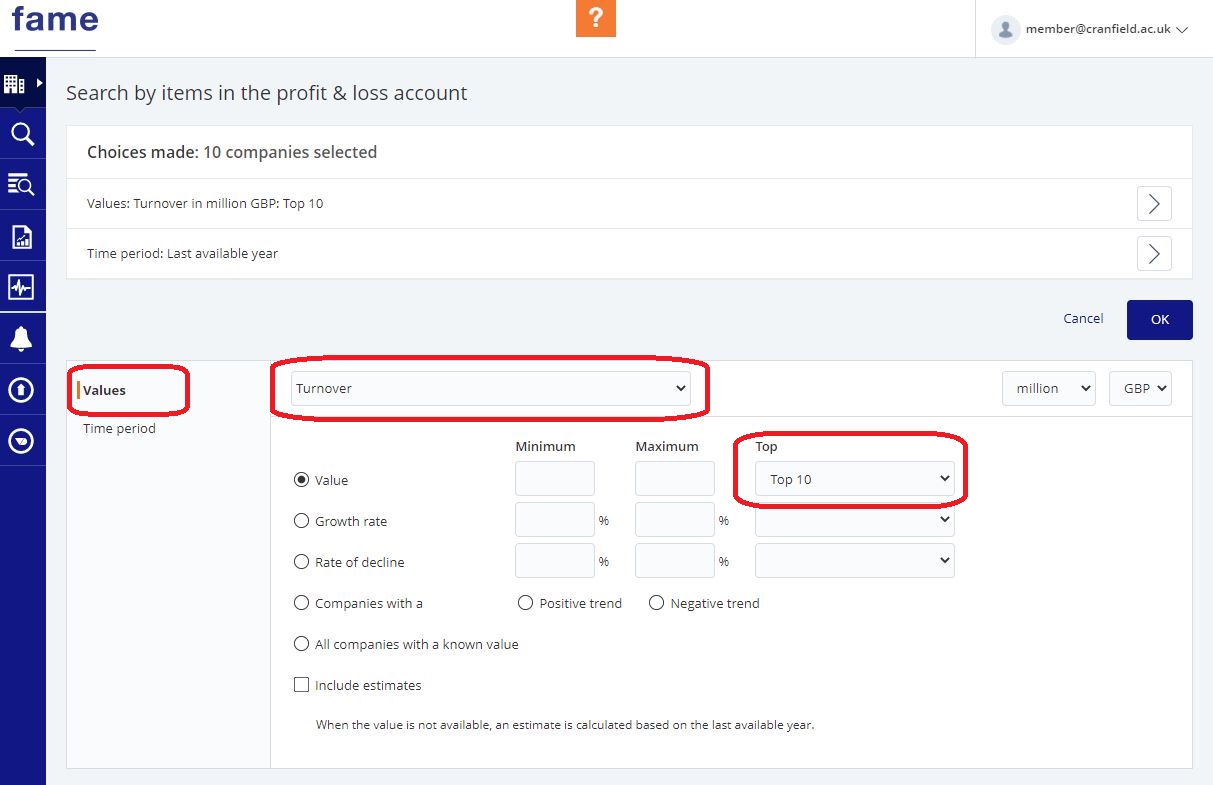
From the search screen, you can add more filters. For instance, to find the biggest supermarkets by turnover:
- Choose Financials from the search menu
- Pick ‘Profit & loss account’ from the righthand menu and select the top 10 companies by Value (you can change the Value from Turnover to a variety of other key financials).
- Click OK.
- Click ‘View Results’ at the right of the screen to display the companies. This is the peer group that you have created
3. Perform peer analysis on your peer group:
- Click the Tools icon on the left and select ‘Peer Analysis’.
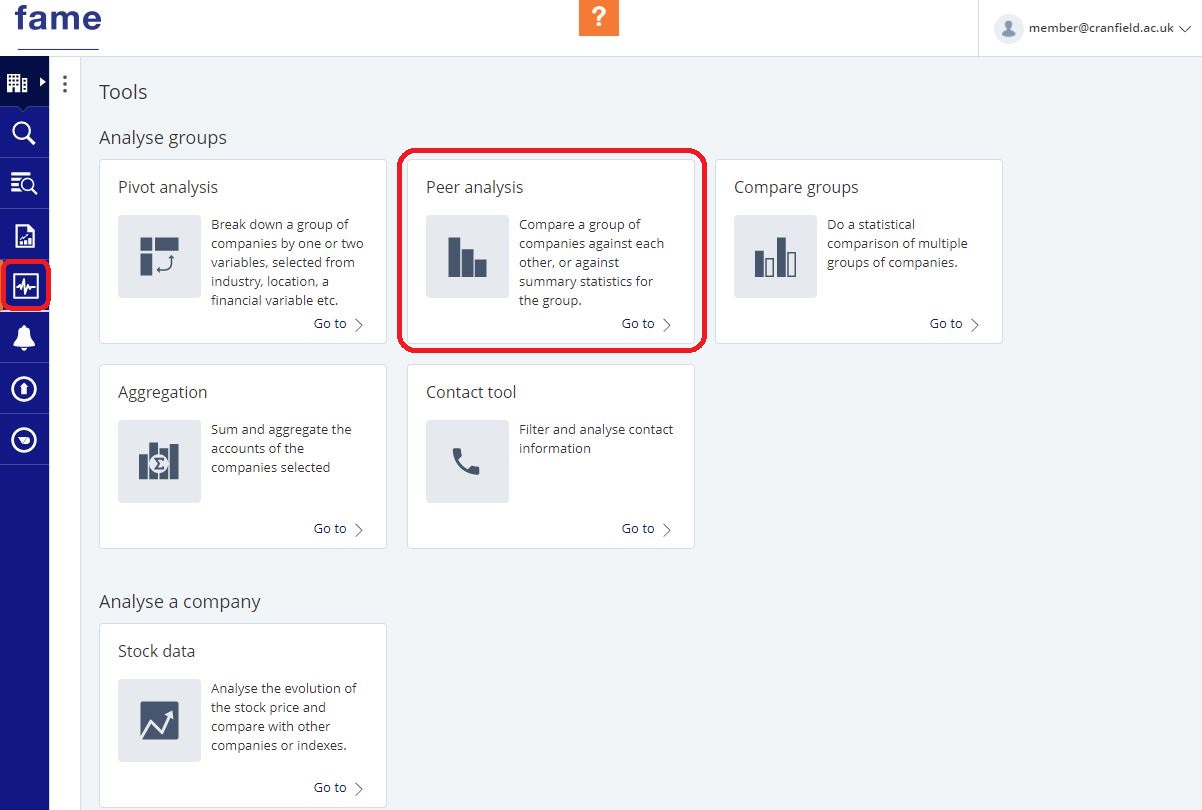
- You can launch a pre-defined analysis, such as ‘Key financials’. Edit the analysis to specify the financial variables and years you want to compare.
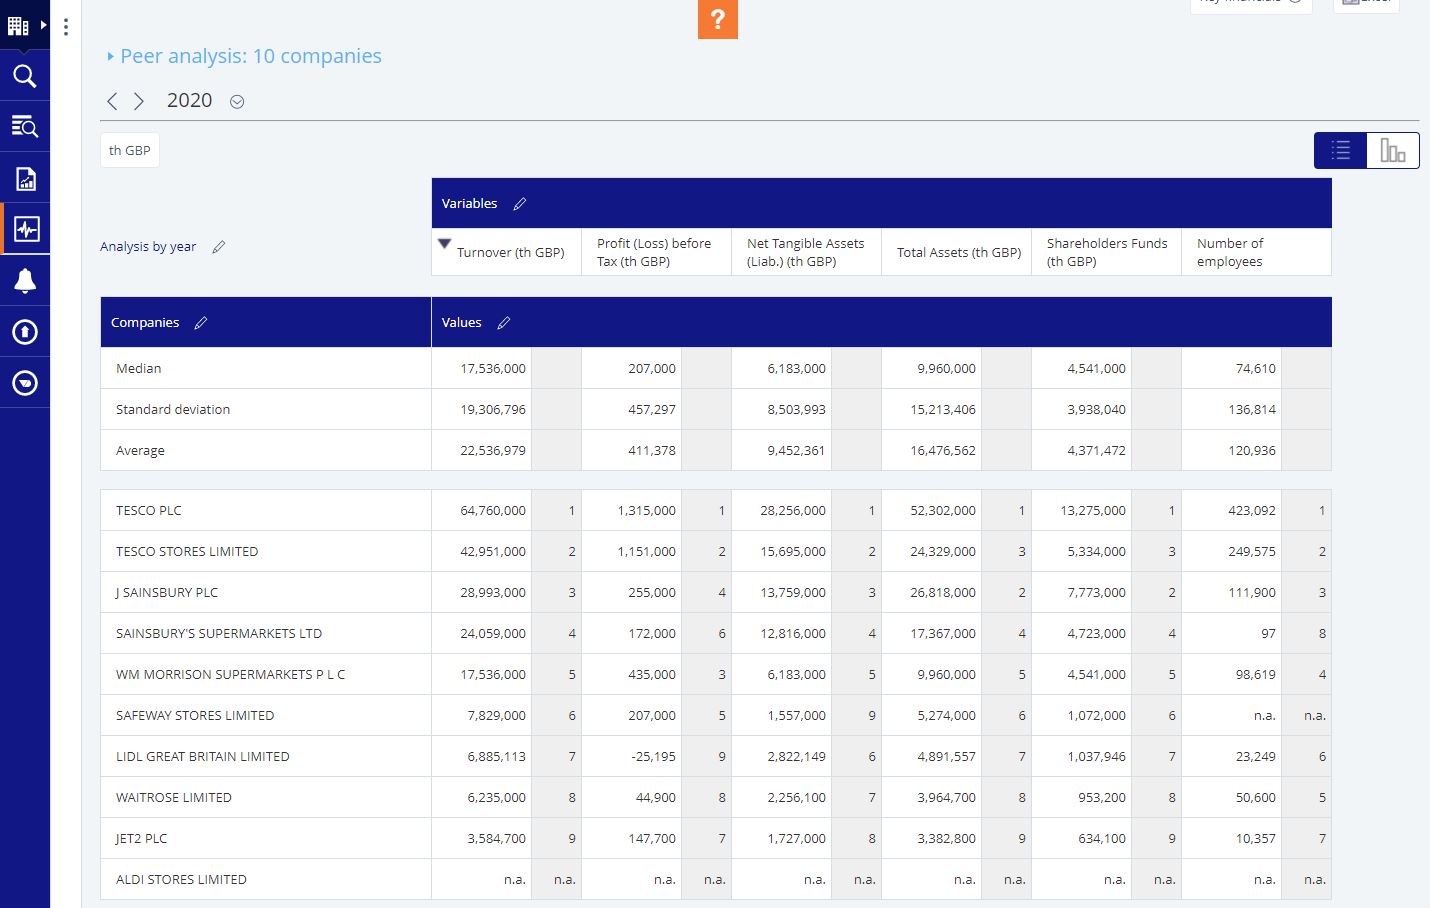
- To export the results, click the Excel icon at the top right of the screen.
If you have any questions about Fame or any of our other financial services please contact us.
Feature image from Pixabay. Available at: https://cdn.pixabay.com/photo/2016/09/19/18/30/calculator-1680905_960_720.jpg
Categories & Tags:
Leave a comment on this post:
You might also like…

Library services over Easter, 3-6 April
Kings Norton Library will remain open for study 24/7. You will need your University ID card to enter the building and can use the self-service machines to borrow and return items as usual. Barrington Library ...

How do I access the full-text of Harvard Business Review (HBR)?
This is a frequently asked question, and it's worth knowing how to access this key management journal. So, how do you access HBR in full-text? The short answer is via our eJournals finder. You can find ...

Engineering problem to solve? Let Knovel help you find a solution
Did you know that Knovel provides you with more than just eBooks? Knovel is a key database for many engineering, mechanical and materials courses here at Cranfield University, and contains content from an extensive range ...

What happens when female scholars meet influential leaders?
On the 5 March 2026, our British Council Women in STEM Scholars had the privilege of sitting down with two excellent role models of industry and academia: Professor Dame Karen Holford, ...

From MSc to CEO: Igniting a research revolution
For many, a master’s degree is achieving a big milestone. Kilyan Ocampo, Computational Fluid Dynamics alumni shares how studying at Cranfield helped launch his career in the energy sector. Today, Kilyan ...
Commuting, collaborating and growing: My first term experience at Cranfield
My first term at Cranfield University has been an extremely positive and rewarding experience. While the course has been intense at times, it has pushed me in the best possible way and allowed me ...