


Creating and using constituent lists in Datastream
08/01/2026

Whether you’re analysing industry performance, or comparing company financials, Datastream is a powerful tool. One of its most useful features is the ability to work with constituent lists — collections of companies grouped by index, sector, or your own custom criteria.
Accessing Datastream
Datastream is available via Workspace from LSEG. Register for a Workspace licence using these instructions and choose Datastream as an add-in. Once you have an account, you can use Workspace (and Datastream) on your own PC/laptop.
To have full Datastream access, you will need to download the Workspace software which will give you access to the Excel add-in. The software should be available in your welcome email but, if not, you will find a link to it from the LSEG website.
You will see that they mention a version of the software for Macs, but this is not fully compatible. The downloaded software is also available on the PCs in the Library, should you have any problems downloading it on to your own device.
What’s a constituent list?
A constituent list is essentially a group of entities used in your research. They might be companies from a particular index (like the FTSE 100 or S&P 500) or sector (like banking or automotive) or they may have no obvious connection other than your interest. These lists let you pull data — such as share price, market value, or earnings per share — for multiple companies simultaneously.
Datastream provides many pre-defined lists, but you can also create your own to suit your research needs.
Why create your own list?
You might want to:
- Exclude certain companies from a defined group
- Include companies from different indices or sectors.
- Build a list from search results based on specific criteria
Custom lists give you flexibility and precision in your data analysis.
How to create a constituent list in Datastream (Excel add-in)
Here’s a step-by-step guide using the Datastream Excel add-in:
- Opening Workspace in Excel
- Open Excel
- Click on the Workspace tab and sign-in
- Click the Datastream Formula tab in the Excel ribbon.
- Finding your base list
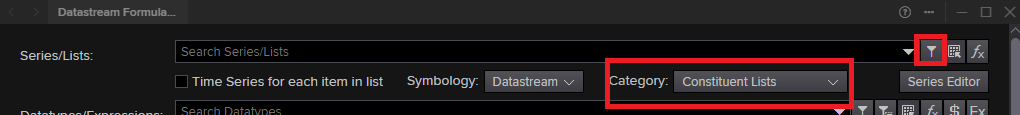
- Change Category to ‘Constituent Lists’
- Click the upside-down funnel icon to the right of the Series/Lists search box to search for a series to open the Datastream Navigator box
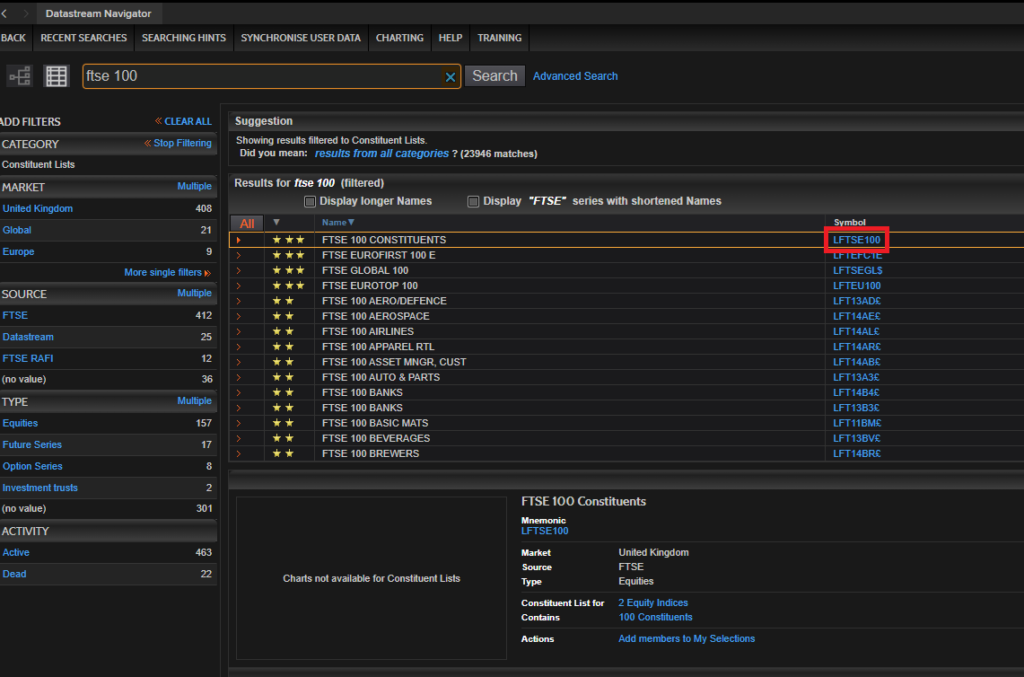
- Type your index into the search box (e.g. FTSE 100) and hit Search.
- Click on the blue mnemonic for the constituent list (e.g. LFTSE100).
- Adding datatypes
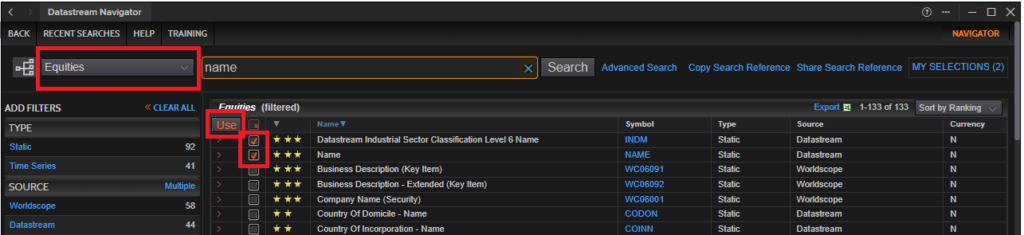
- Click the upside down funnel to the right of the Datatypes/Expressions search box
- Make sure the series type is set to Equities.
- Search for datatypes as required, like:
- Company Name (NAME )
- Industry Name (INDM)
- Any other financial metrics you need
- Select one by clicking on the blue mnemonic, or multiple by ticking the box and clicking on ‘Use’
Tips:
- Click the red arrow to the left of a series/list or datatype to see its definition in the box below. Items with ⭐⭐⭐ are usually key ones.
- Always include NAME in your datatypes so you can identify companies in your results.
- Submitting your request
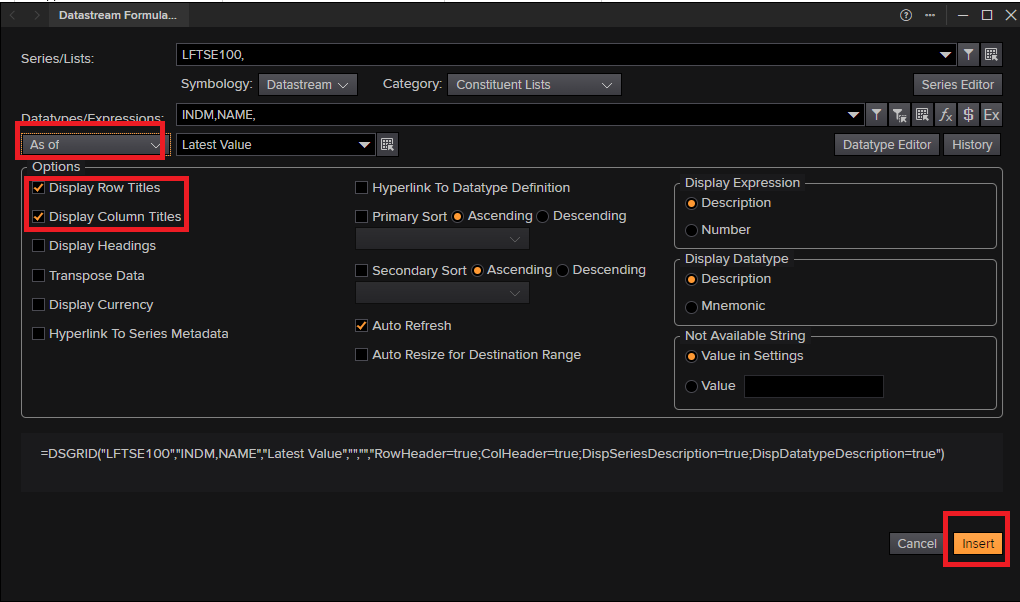
- Change the timespan from ‘start-end’ to ‘as of’ and amend date setting if required
- Choose display options (Row/Column titles recommended – these are chosen by default)).
- Click Insert to generate your list.
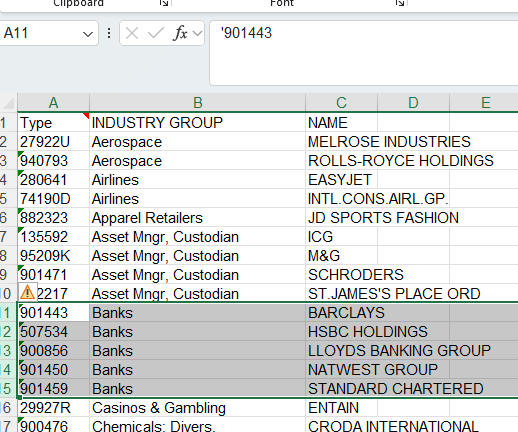
- Editing your list
Now you can edit the constituent list in Excel to create your own list. If, for example, you want your list to be FTSE 100 companies, without banks or financial firms you would:
- Use Excel’s Sort feature to organise by Industry.
- Delete companies you don’t want (e.g. banks or financial firms).
- Creating and saving the list
Once you’ve got your final list:
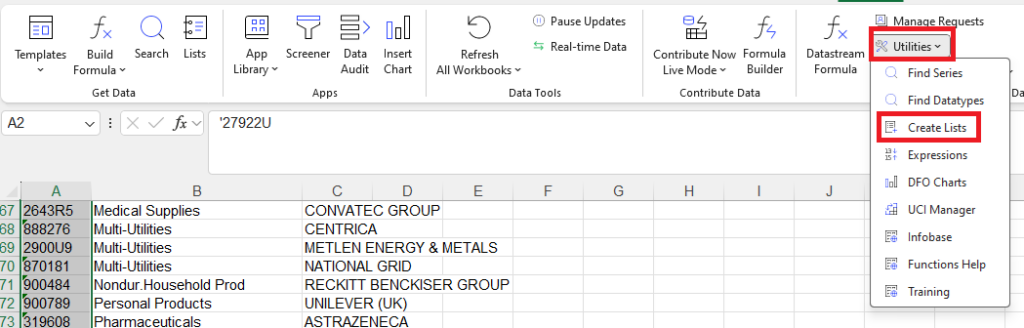
- Highlight the Datastream codes (in the ‘Type’ column).
- On the Datastream toolbar, under Utilities, choose ‘Create Lists’.
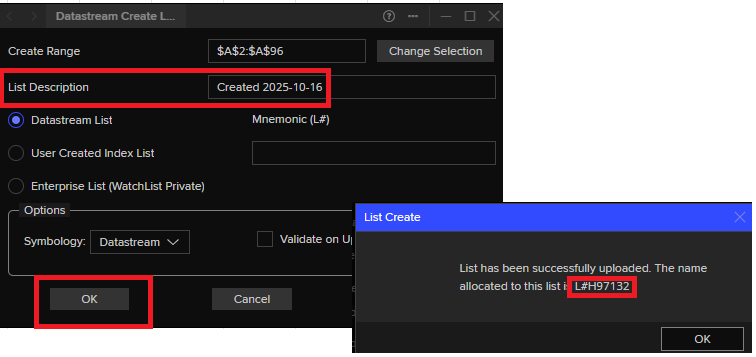
- Click OK in the Datastream Create Lists pop up box (you can amend List Description if you want, to make your List more memorable and searchable).
- A confirmation box will appear with your list’s mainframe name (e.g. L#H97132). Save this list name! Click OK
How to use your saved list
You can now use your list in Static or Time Series Requests:
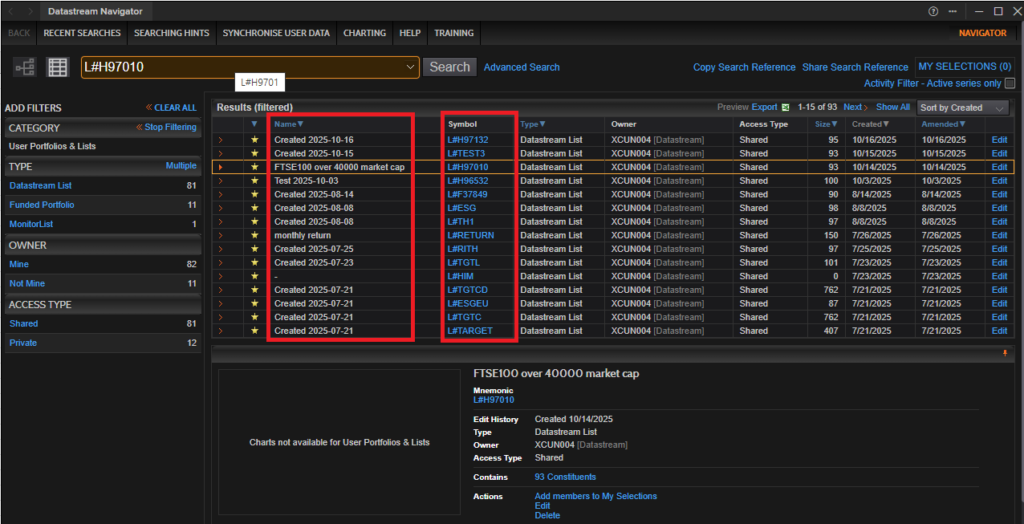
- In Datastream Formula, change Category to ‘User Portfolios & Lists’
- Click on the upside down funnel
- You can search by description (here in ‘Name’ column) or by name of your list (here in ‘Symbol’ column eg L#…)
- Click on blue mnemonic to choose list
- Add the metrics you want from Datatypes as per Step 3 above (if using Time Series Requests, don’t forget to change ‘As-Of’ to ‘Start-End’ and make any necessary amendments to timespans)
- Click on Insert
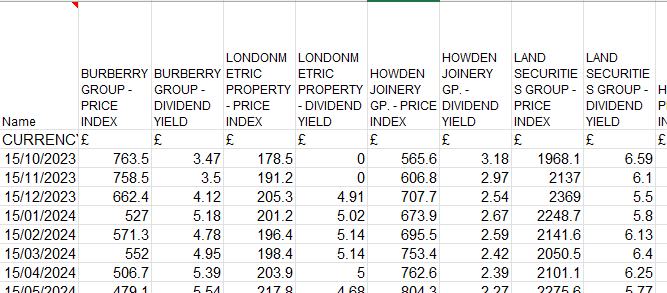
- The example below uses our amended FTSE 100 list to retrieve monthly figures for price index and dividend yield for our specified companies.
Feature image from Pixabay. Available here: https://pixabay.com/photos/business-stock-finance-market-1730089/
If you would like to know more about Datastream, LSEG Workspace or any other financial resource, please contact the Library team.
Categories & Tags:
Leave a comment on this post:
You might also like…

Norman C. T. Liu scholarships providing the next generation of opportunities to succeed in Air Transport Management
Cranfield University is proud to work with global industry leaders who believe in investing in the next generation of aviation professionals. One of those leaders, Norman C. T. Liu, has personally committed to supporting ...

Designing the future of space: My group design project experience at Cranfield
For three years, I worked at Tata Consultancy Services (TCS) in India. While my time in the IT sector provided me with a strong analytical foundation, my true passion had always been anchored in ...

How do I reference lecture notes… in the NLM style?
If your course material contains original content that you want to use in your work, it will need to be referenced as follows: What information do you need in the reference? Author – surname initials e.g. ...

From Nigeria to Cranfield: My journey into Future Food Sustainability
My name is Jolaosho Eniola, and I’m studying the MSc in Future Food Sustainability. I’m originally from Nigeria, and I’m passionate about food systems, food sustainability, food supply chain and creating solutions that improve ...

How to present well as a group
You will have put a lot of work into your research or group project and want to show everyone what you have achieved or discovered, so you need to impart this knowledge as clearly as ...

Building more than research: Reflections from the ECRn Symposium 2026
There’s something quietly powerful about a room full of early career researchers. Not just the ideas, although there were plenty of those—but the conversations, the curiosity, and the sense that everyone is figuring things ...
Comments are closed.