


Introducing… W – Bloomberg’s Security Worksheet function
27/02/2025

Bloomberg users, are you fed up hitting download limits? Do you want to create custom templates that download only the data you want and nothing else?
Using many of Bloomberg’s download templates often leads to downloading large quantities of data that you don’t need, eating into your terminal’s download quota. Until now! Login to the terminal and check out Bloomberg’s new ‘Worksheet’ function. Just type W <GO>.
The W function allows us to create a worksheet with multiple rows and columns with no impact on the download limit until you actively choose to export the worksheet to Excel. You can also save your worksheets for reuse all in one place. This allows you to create a new worksheet for each of your research requirements, where you specify the equities/financial instruments and the data you want. You can also copy and edit worksheets from Bloomberg’s Sample Library. Type WSL <GO> to see the choices. There are many to choose from.
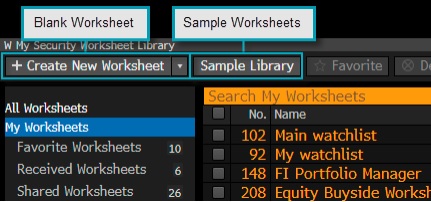
Bloomberg’s Worksheet Library
Creating a new worksheet
- Choose ‘+ Create new worksheet’ and select the basic worksheet. Three default data columns will be provided alongside the Ticker – Last Price, Net and %1D.
- Double click the orange box under the Ticker heading. Here you can enter a security, index, some text. a list of securities or even drag and drop a list of tickers from Excel. In our example below, we typed UKX (for the FTSE 100 index).
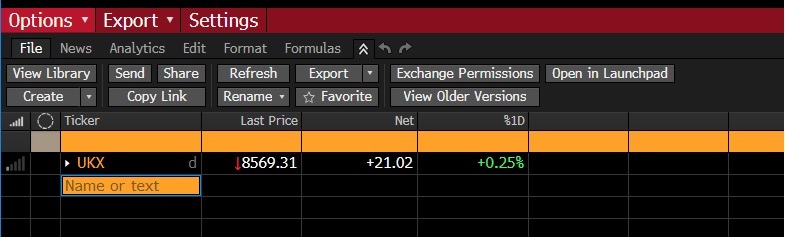
Creating your new Worksheet
- Using an Index here will display values for the index as a whole. To show its components individually (constituents or the equities in the index), click on the arrow to the left of the index name. If you need to add more columns of data, click on the column header and simply search for the data that you are looking for. In the example below, I chose total assets.
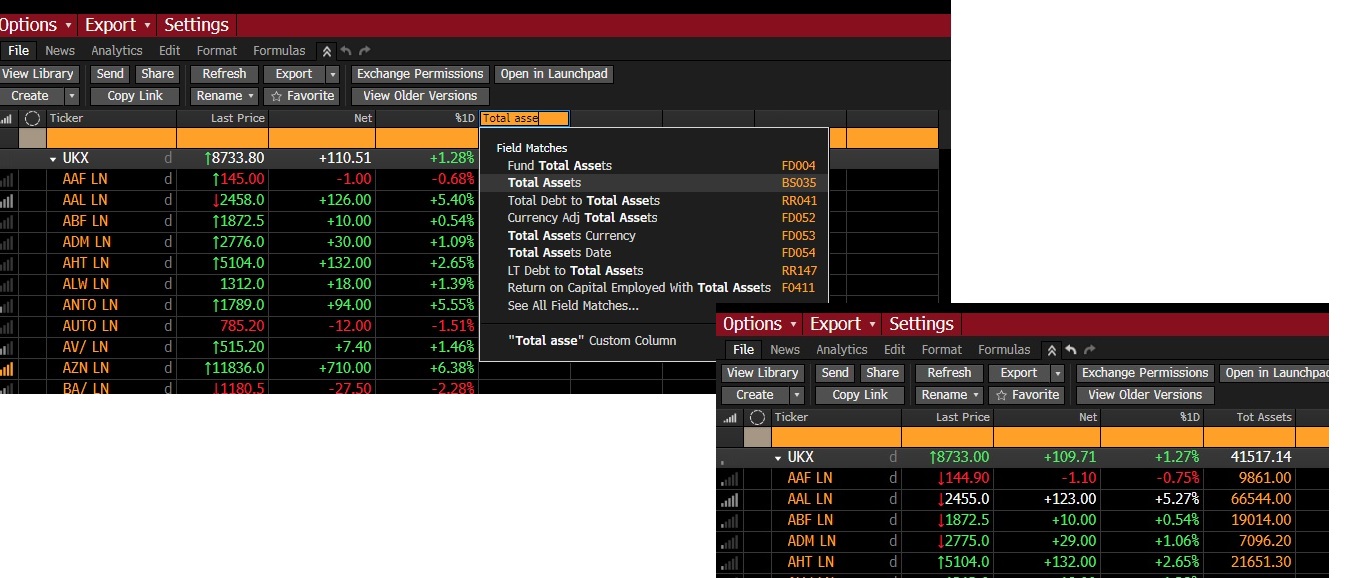
Adding a new column to your security worksheet.
Generally the data in the columns will be current data, however it is possible to add historical data by right clicking on the column heading, selecting ‘Edit Column parameters’ and choosing the interval (dates) you wish to retrieve data from.
It is also possible to add news and event icons if you want to keep abreast of company news. Click on the ‘News’ tab and make your selections.
Finally, when downloading from other functions in Bloomberg, you may find the option to export your securities to a Worksheet, for example, when using the EQS function to identify equities that match a set of criteria, as briefly described in our earlier post.
Once you have finalised the Worksheet required you can then export the data to Excel. Install the Bloomberg office add-in before exporting and then choose from either the red command line: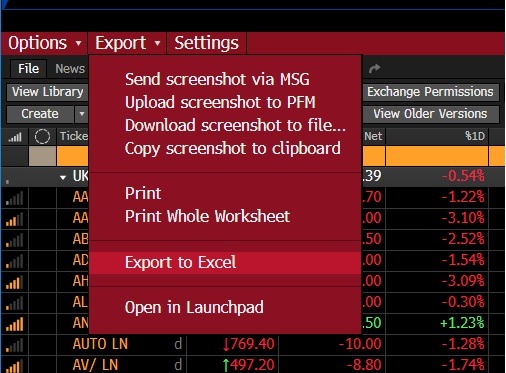 0r from the grey buttons underneath :
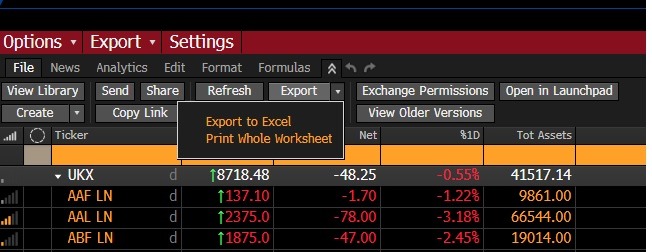
Only at this point will the amount downloaded count towards any download limit on the terminal that you are using.
If you want to learn more about the W function press the green ‘Help’ key on the Bloomberg keyboard or click on the ? that appears at the top right of all Bloomberg screens.
If you have any questions about Bloomberg or any of our other financial resources please contact us.
Categories & Tags:
Leave a comment on this post:
You might also like…

Building more than research: Reflections from the ECRn Symposium 2026
There’s something quietly powerful about a room full of early career researchers. Not just the ideas, although there were plenty of those—but the conversations, the curiosity, and the sense that everyone is figuring things ...

Library services over Easter, 3-6 April
Kings Norton Library will remain open for study 24/7. You will need your University ID card to enter the building and can use the self-service machines to borrow and return items as usual. Barrington Library ...

How do I access the full-text of Harvard Business Review (HBR)?
This is a frequently asked question, and it's worth knowing how to access this key management journal. So, how do you access HBR in full-text? The short answer is via our eJournals finder. You can find ...

Engineering problem to solve? Let Knovel help you find a solution
Did you know that Knovel provides you with more than just eBooks? Knovel is a key database for many engineering, mechanical and materials courses here at Cranfield University, and contains content from an extensive range ...

What happens when female scholars meet influential leaders?
On the 5 March 2026, our British Council Women in STEM Scholars had the privilege of sitting down with two excellent role models of industry and academia: Professor Dame Karen Holford, ...

From MSc to CEO: Igniting a research revolution
For many, a master’s degree is achieving a big milestone. Kilyan Ocampo, Computational Fluid Dynamics alumni shares how studying at Cranfield helped launch his career in the energy sector. Today, Kilyan ...