


How do I create a share price graph in Bloomberg?
12/09/2024

One of the simplest – and coolest – things even a beginner can do on Bloomberg is to produce a company share price graph. If you’ve never done this before – or if the very thought fills you with horror – read on. This post will show you how.
The first time we meet the Bloomberg price graph tends to be when browsing through a company’s Equities menu. Find a company first using whichever method you prefer and, from its equities menu, if you use it, select option <GP Line Chart>.
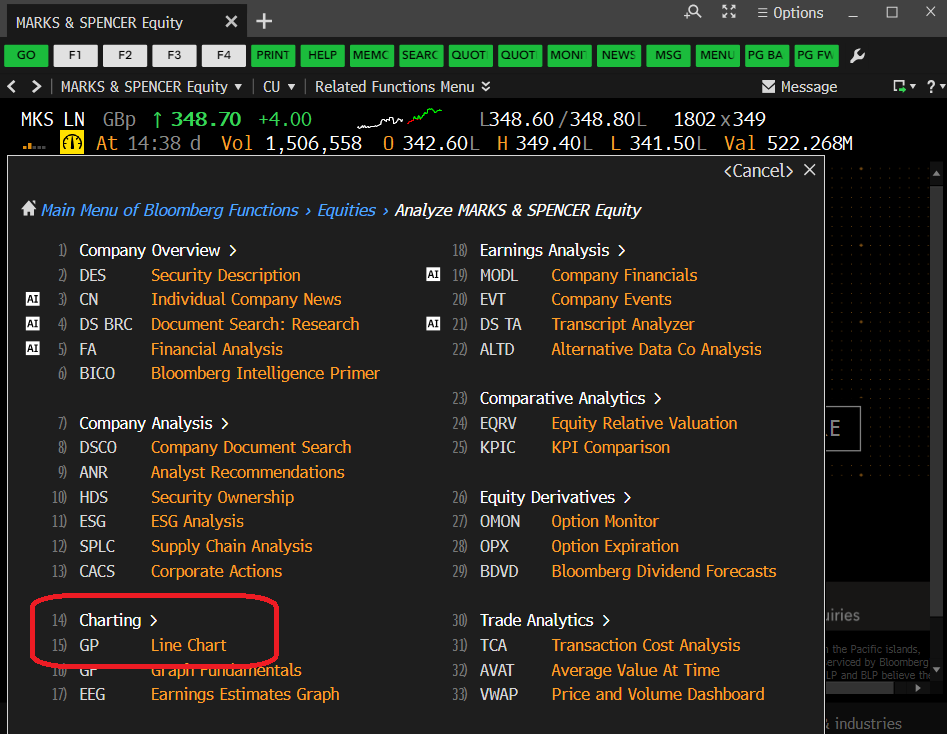
The Bloomberg Equities menu, showing the GP option
Selecting <GP> should take you instantly to a 12 month price chart, looking a lot like that displayed below (well, it should if you’re looking at Marks & Spencer!). The top panel of the graph displays share price and the lower panel indicates the volume of shares traded on any particular date.
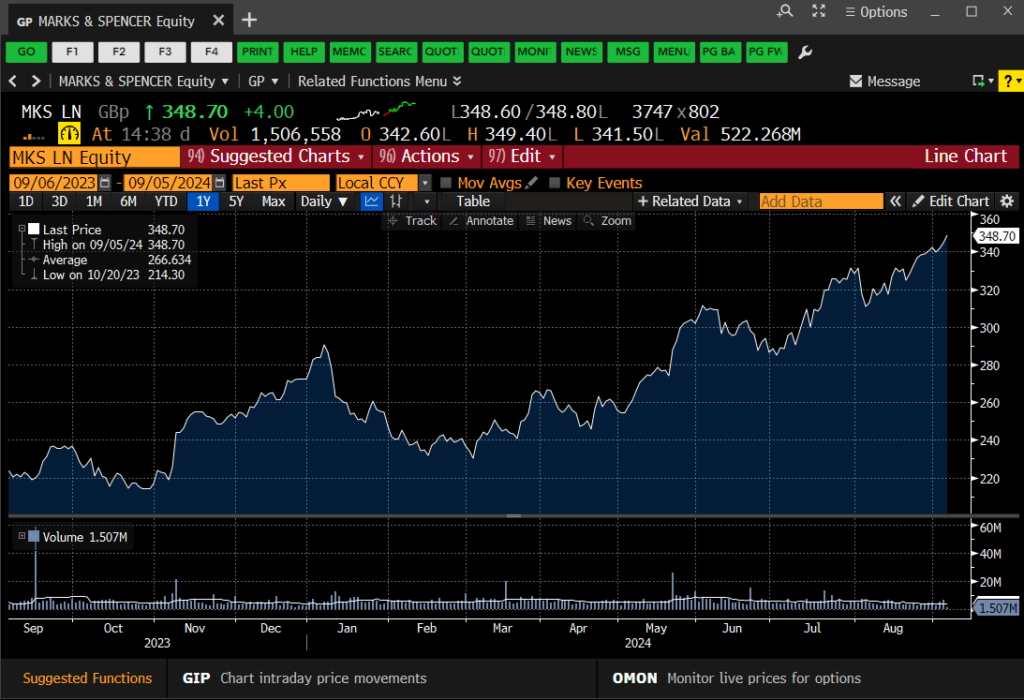
The Bloomberg GP Price Graph
Very nice, I hear you say, but is that it? Well, no, of course it’s not. This is Bloomberg. There are lots of things you can do here to make your chart more exciting or relevant. You can…
- Select another pre-defined time period. Use the options (1D, 3D, etc.) at the top-left of the chart to select.
- Define your own time period. Use the orange date boxes to create your own fixed date range. (NB: In Bloomberg anything in an orange box can be clicked on and edited).
- Add in competitor companies or indices for comparison purposes. Click on ‘Edit’ > ‘Securities & Data’ on the red bar to do this.
- Add in tags for ‘Key Events’ via the on-screen icon. Add your own annotations using the ‘Annotate’ option.
- Bloomberg’s default chart format is a line chart, but those of you who want more detail can change to a candlestick graph or similar by clicking on candlestick icon above the chart.
- Normalise your graph. Give all the datasets a starting value of 100 to track their fluctuations against one-another. See below. Available via the ‘Edit’ function.
- Change backgrounds and line colours from defaults. Edit your chart legend Available via the ‘Edit’ function.
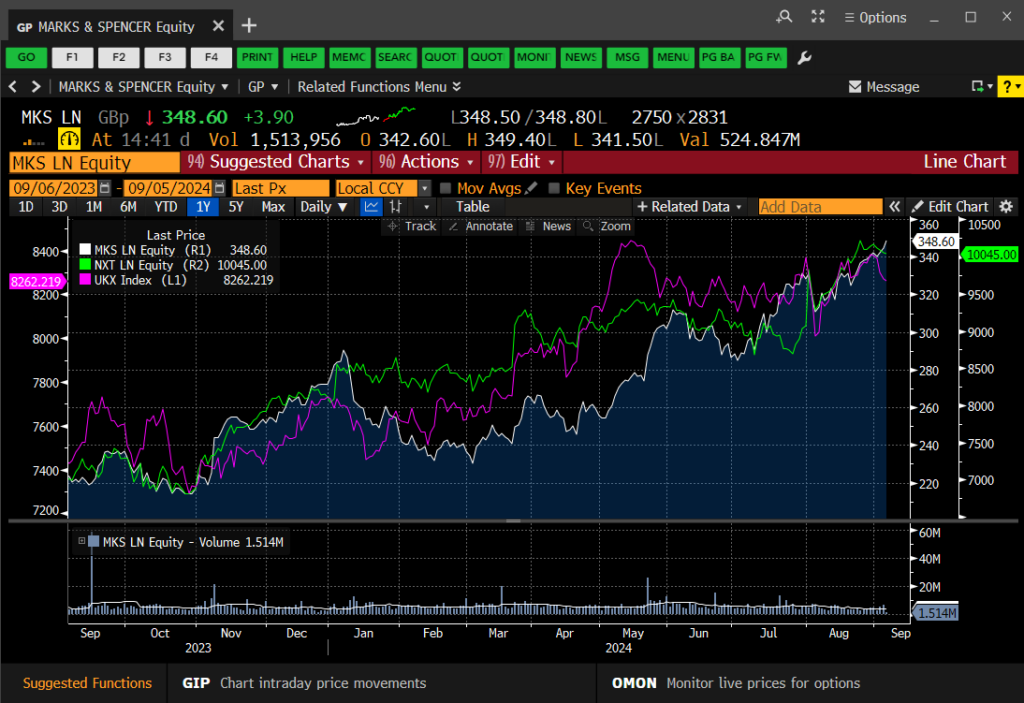
Charting multiple data series in your GP line chart
Once your graph is complete, simply right-click on it and copy the image to the clipboard, then paste it straight into MS Word or Excel. If you would rather download the data behind it, right-click and choose to copy the data instead.
If you’d like to know more, or to arrange a Bloomberg taster session, contact the Library.
Categories & Tags:
Leave a comment on this post:
You might also like…

All about standards
What are standards? Standards are documents outlining in detail the rules, guidelines or characteristics for specific products or processes. Standards may be a legal requirement or voluntary. Standards cover many sectors from engineering and business ...

Want to improve your reading skills?
Are you starting to read through the mountains of journals, books or articles for your project or on your course reading list? Let’s start with a few myths about the reading process: You need to ...

Driving the future of automotive excellence with three new scholarships
Cranfield University has a long history within the top echelon of motorsport, car development and safety designs within the automotive industry, working in the era where we’ve seen significant safety improvements, engineering feats and ...

Academic writing and being critical
Academic writing is daunting. Capturing all your thoughts and analysis and putting them down onto paper in some sort of understandable fashion is a challenge. Did you know we have resources in our Cranfield Study ...

My Cranfield experience: How studying for the Strategic Marketing MSc landed me a job in my dream industry
For Shraddha Mahapatra, studying for a postgraduate master’s degree at Cranfield School of Management unlocked the path to a career working in her dream industry sector. Shraddha had gained an MBA in her native ...

Keen to develop your study skills?
Alongside the technical skills and academic knowledge that you will gain on your course, as a Cranfield student you have the opportunity to develop a range of other skills that can enhance your learning experience. ...