Water quality: When are bacteria dead?
19/04/2017

Accurately testing the quality of our water is vital to ensure the safety of the water in our taps. It is essential that we are able to measure and monitor water quality accurately to ensure that the threat from bacteria harmful to human health is effectively removed.
Current approaches to microbiological water quality assessment are based around plate-counting, where the bacteria contained in water is applied to agar plates, allowed to grow and then the number of colonies that form are counted. This is a binary method, showing the presence or absence of bacteria. When no bacterial colonies are present, the drinking water is considered safe to drink. However, only 1-2% of bacteria are ever cultured per sample, as they will only grow in favourable conditions. As a result, some “living” bacteria which are not detected by this method may still be present in the water. Therefore, new techniques to monitor and regulate water safety are being investigated.
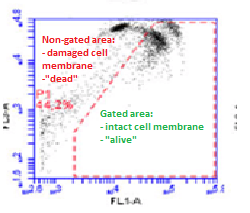
One technique which avoids this limitation is the Flow Cytometry Method (FCM). This approach measures the concentration of bacteria when suspended in fluid and passed through an electronic detection instrument. The method allows the bacteria present to be visualised, enabling all microbiological cells to be counted. It is also much faster than the standard plate counting method as the presence of bacteria can be detected in a matter of minutes compared to a matter of days. When water is treated with disinfectant, the bacterial cell membranes are damaged. The cell membrane protects the contents of the cell and so a damaged cell membrane is a very good indicator of a cell being “dead”. In the FCM, fluorescent dyes are added that enter different cells depending on the state of their cell membrane; a green dye enters all cells regardless of the state of their cell membrane, while a red dye only enters the bacteria that have cell membrane damage. The intact and damaged bacteria can then be visualised on a scatter plot. Those that appear within a defined area, called a gate, can be identified as those with intact cell membranes and are “living” bacteria. Those outside of the gate are identified as damaged and therefore “dead” bacteria. The scatter plot shows a transition from intact to damaged bacteria cells, or from “living” bacteria to “dead” bacteria, as the bacteria appear to move across the plot from the gated to the non-gated area (see Figure 1). 
A team led by Professor Peter Jarvis, of Cranfield Water Science Institute, recently published a paper in the journal Environmental Technology, which reports the findings of a study looking at the use of this method for water quality testing compared to traditional plate-counting methods. The study found that, under laboratory conditions, the two methods showed similar trends when used to test whether E. coli bacteria are killed by treatment with different concentrations of chlorine as a disinfectant. However, the FCM analysis showed that cells could still be deemed as “living” at higher concentrations of disinfectant compared to the plate-counting method. When no bacteria were identified by plate-counting (i.e. all bacteria were deemed “dead”), the bacteria still appeared in transition from the gated area to the non-gated area on the FCM scatter plot and so some bacteria were still “living”. This suggests that FCM analysis is more accurate in identifying the presence of “living” bacteria. When using real water samples, bacteria were identified as present using plate-counting when they were in transition on the FCM scatter plot, so both methods show that there were still some ”living” bacteria. This suggests even greater congruence between the two methods for identifying when bacteria are effectively killed in real water samples.
Water service providers invest a large amount of expertise and resources into ensuring that our water supplies are safe to drink. This new study demonstrates the potential that FCM has to improve both the accuracy and the speed of water quality testing. Further research is needed to identify which bacteria remain present after disinfection and whether these are harmful to human health. The permanence of disinfecting bacteria in real water samples also needs to be investigated. The paper reports a welcome starting point in this line of research and shows great promise in the use of FCM analysis in water quality testing. As the plate-counting approach is currently mandated by the water quality regulator, revisions to regulation and policy would need to be devised if widespread water quality testing with FCM is to become a reality. If FCM is proven to be an accurate method as well as a faster method for monitoring water quality, this will help to ensure the safety of our water, for drinking, farming and industrial use.
To read the full paper, please click here.
Categories & Tags:
Leave a comment on this post:
You might also like…
Keren Tuv: My Cranfield experience studying Renewable Energy
Hello, my name is Keren, I am from London, UK, and I am studying Renewable Energy MSc. My journey to discovering Cranfield University began when I first decided to return to academia to pursue ...
3D Metal Manufacturing in space: A look into the future
David Rico Sierra, Research Fellow in Additive Manufacturing, was recently involved in an exciting project to manufacture parts using 3D printers in space. Here he reflects on his time working with Airbus in Toulouse… ...
A Legacy of Courage: From India to Britain, Three Generations Find Their Home
My story begins with my grandfather, who plucked up the courage to travel aboard at the age of 22 and start a new life in the UK. I don’t think he would have thought that ...
Cranfield to JLR: mastering mechatronics for a dream career
My name is Jerin Tom, and in 2023 I graduated from Cranfield with an MSc in Automotive Mechatronics. Originally from India, I've always been fascinated by the world of automobiles. Why Cranfield and the ...
Bringing the vision of advanced air mobility closer to reality
Experts at Cranfield University led by Professor Antonios Tsourdos, Head of the Autonomous and Cyber-Physical Systems Centre, are part of the Air Mobility Ecosystem Consortium (AMEC), which aims to demonstrate the commercial and operational ...
Using grey literature in your research: A short guide
As you research and write your thesis, you might come across, or be looking for, ‘grey literature’. This is quite simply material that is either unpublished, or published but not in a commercial form. Types ...


Are you also looking at pseudomonas and legionellae?