


Every drop counts: Water conservation at Cranfield University using smart technology
20/02/2020

About 71% of the Earth’s surface is water-covered (that’s two thirds). 3% of this is freshwater and less than 1% of the Earth’s freshwater is accessible for humans. This leaves only 0.007% of the planet’s water available to fuel and feed 7 billion people. There is therefore a constant global challenge to conserve, manage, and distribute the water we have.
Many people in the world exist on 10 litres of water or less a day. In the UK, each person consumes approximately 142 litres per day; just one flush of the toilet uses around nine litres, and only 2-3% of this 142 litres is used as drinking water. The Cranfield University campus uses on average around 160 million litres of water a year. This includes water used in common areas on campus (sports field, horticulture), in toilets, sinks, laboratories, shops and cafeterias, water used for heating and by students who are accommodated on campus.
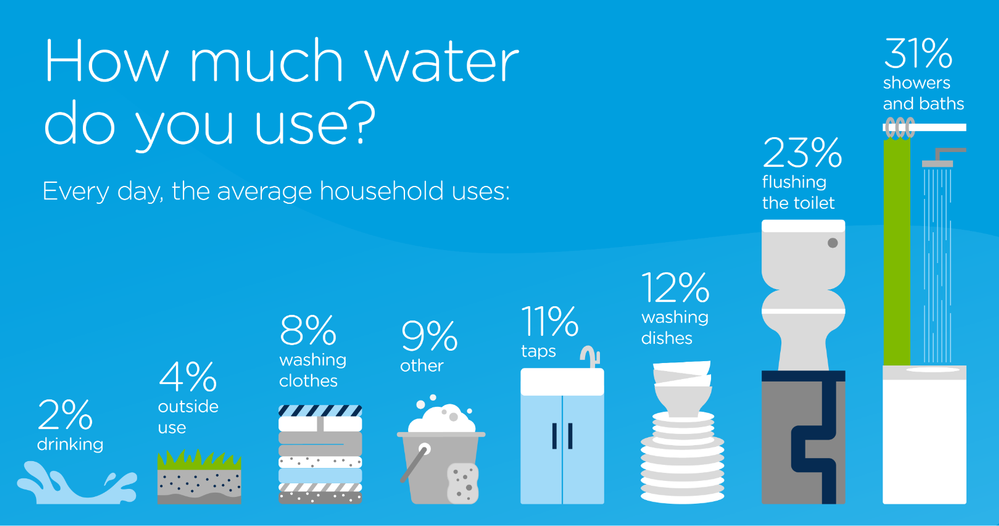
Our use of water and energy are closely linked. Heating water is the second largest source of energy use in the home (next to heating). 21% of a typical gas heated household’s heating bill is from heating the water for showers, baths and hot water for the tap; this according to the Energy Saving Trust equates to around £140 a year being spent on heating your water.
Therefore, heating your water is a major source of emissions. The energy used to heat water for devices and appliances emits an average of 875kg of CO2 per household per year. This is the same as the CO2 emissions from driving more than 1,700 miles in an average family car (that’s the distance to Turkey!). Minimising the amount of water/energy used will not only reduce our financial cost, but also reduce the demand, and therefore help conserve water for the future.
What action can we can take and how do we change our behaviours?
In order to understand behaviour we need to collect data. Then, to change behaviours we need to be able to compare the effect against the original data – before and after. There are lots of instances of real-time data – you might have them in your house – meters in the home for water, energy, or even counting how many hours you spend on your phone. Smart devices incorporating display technologies can also be used to gather long-term data on water consumption behaviours (such as showering), and provide water users with real-time feedback.
We have an exciting new project here at Cranfield University, part of the Urban Observatory network funded through UKCRIC which examines different infrastructure solutions, including the latest sensor technology. We are interested in collecting data on how long students at Cranfield shower for (their behaviour). Once we know the average shower time among students here at Cranfield, we can begin to understand their showering habits and motivations to change behaviour to reduce water consumption, and costs.
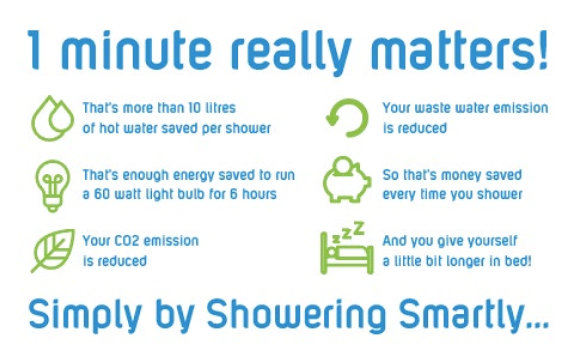
Did you know…? In Europe, the average shower time is between 6-9 minutes (87% of people do not exceed 10 minutes). Longer showers are on the rise. This might be due to stress relief or better technology. A 5-minute shower uses around 35 litres of water (remember that many people in the world exist on 10 litres of water or less a day…). If we reduce this by one minute, we could save enough water to supply one million homes every day (Waterwise UK). Reducing the time you take to shower or the amount of hot water you use for cleaning dishes has a significant impact on your personal carbon footprint.
But how do we change showering behaviour?
We first need to collect the data – we know on average how long people in Europe are showering for, but we need more information about showering habits at Cranfield. For example, are people showering once or twice a day, and how long for? To do this, we installed sensors in various accommodation on campus. We could just ask people about their showering behaviour but relying on self-reports can be unreliable and inaccurate (e.g. “I think I do this…”) compared to actual behaviour. The sensors activate once a person enters the shower cabin and the water is turned on and off. The sensors are able to detect humidity, sound and motion and this data is collected and sent via Wi-Fi to a cloud where the information is stored and can be analysed.
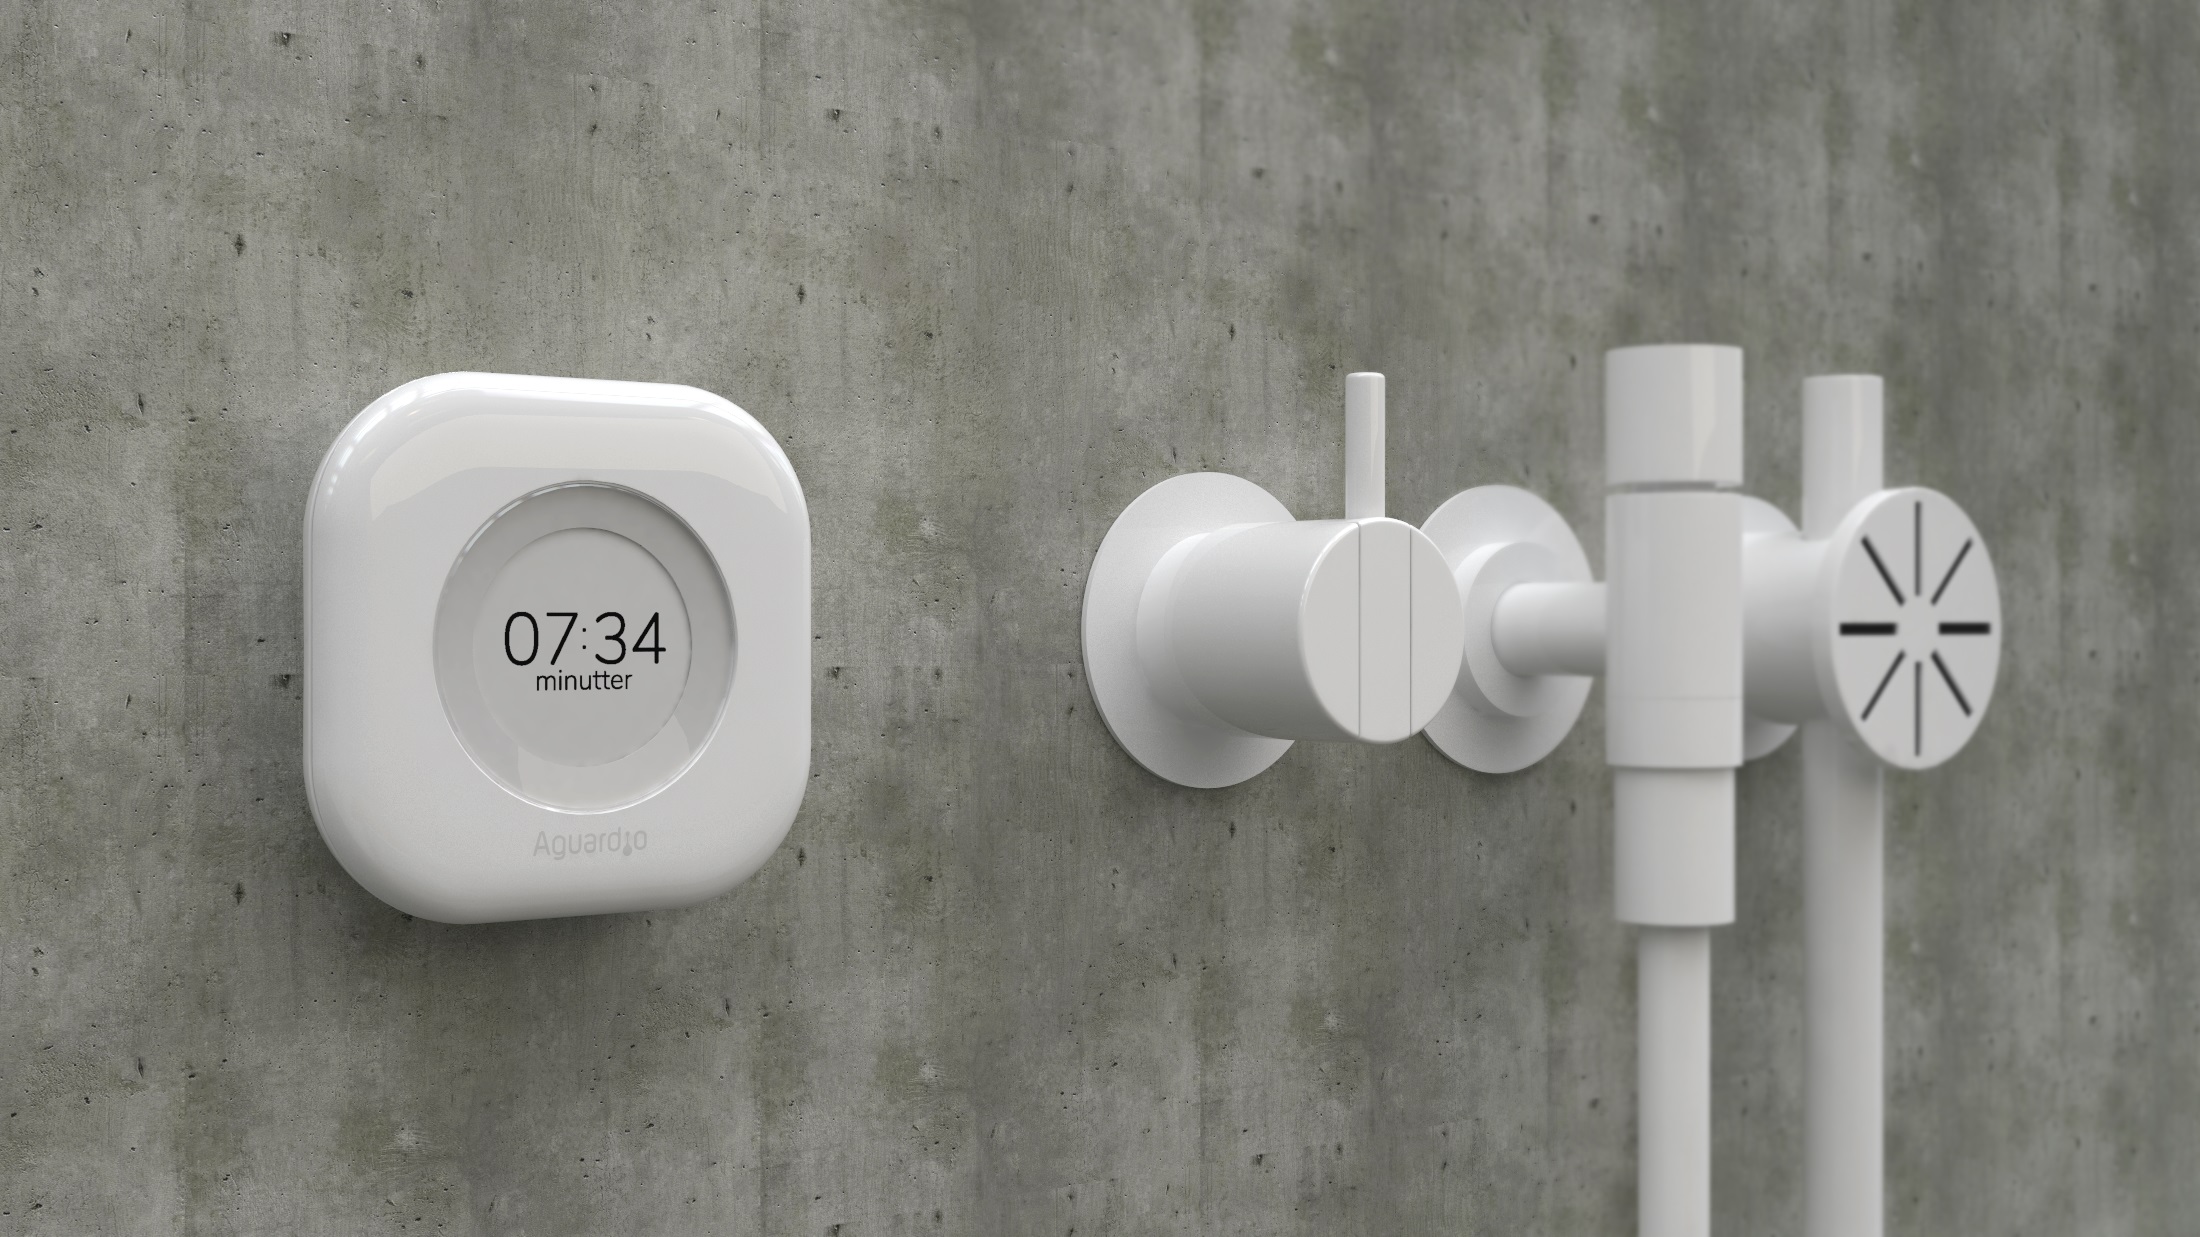
Showers in some accommodation were also paired with a display, showing a timer (counting up in seconds) which acts as a prompt to remind people how long they have been showering for. At this point in time, the individual does not know how long the average shower is, but it is just so they are aware of how long they are showering for. We can then compare showers with displays and those without to determine whether the display and visual reminder of how long people are showering for has any impact on the average shower time. We can then compare various accommodation types, such as shared housing, family housing, single occupant, and certain demographic details.
Over a four-month period we found that showers with the display units had significantly shorter shower times compared to those with the sensors only, between 20-30%. These initial findings provide insight around the effectiveness of unobtrusive sensors in capturing data on hidden water-use behaviours, and the influence of real-time feedback displays on behaviour. These findings are informing a much larger trial that will incorporate additional forms of messaging, in order to explore the effects of different influential factors (e.g. social norms) over the longer term.
This research can help to:
Although it is in its early stages, this research can help to reduce water and energy consumption at Cranfield University. This technology has also been used within hotel rooms and has resulted in an 11-23% reduction of water use. This research will contribute to a better understanding of pro-environmental behaviour (in particular hidden behaviours).
With a high-level threat of water security for nearly 80% of the world’s population, adopting better behaviours to reduce our water consumption and demand can help address this global challenge.

The research benefitted from use of UKCRIC’s Cranfield Urban Observatory, which was funded under EPSRC grant no. EP/P016782/1 , and support from the UKCRIC Coordination Node, EPSRC grant number EP/R017727/1, which funds UKCRIC’s ongoing coordination.
Categories & Tags:
Leave a comment on this post:
You might also like…

Finding successful past Cranfield theses
It’s always a good idea to look at examples of theses before you start work on your own. You may find them valuable for reading previous research, and for looking at structure, style and methodology. ...

On‑campus or off‑campus? How Cranfield students found their home away from home
Finding the right place to live is one of the biggest decisions you’ll make as you begin your student journey. Whether you’re looking for the convenience and community of living on-campus or the independence ...

Avoiding common referencing errors
As librarians, we get to see the full spectrum of reference lists in student work —from exemplary to … well, let’s just say, works still very much in progress! We are experts in spotting mistakes ...

Using your Mendeley library after you have left Cranfield
So you have spent the whole year (or more) lovingly collecting references around the topics that matter to you and now you have a large, personalised library in Mendeley Reference Manager containing all that information. ...

Referencing the use of generative AI in your work
We recognise that Artificial Intelligence (AI) has, and will increasingly, become a part of our everyday lives and that we need to adapt to it. Hopefully you will have already seen the guidance for staff ...
Finding part-time work whilst studying at Cranfield – is it right for you?
We know that the cost of living in the UK is a real and ongoing challenge for many students. Whether you are still considering postgraduate study or already preparing for life at university, you ...