


Searching Statista: Effective strategies and Research AI tips
14/04/2025

Statista is a global data and business intelligence platform with an extensive collection of statistics, reports, and insights on over 80,000 topics from 22,500 sources in 170 industries. It offers data on the global digital economy, industrial sectors, consumer markets, public opinion, media, and macroeconomic developments, and it provides powerful tools for data visualization and in-depth research, making it invaluable for students and professionals.
Search bar basics:
Start with the search bar on the Statista homepage. It’s your gateway to a wealth of data.
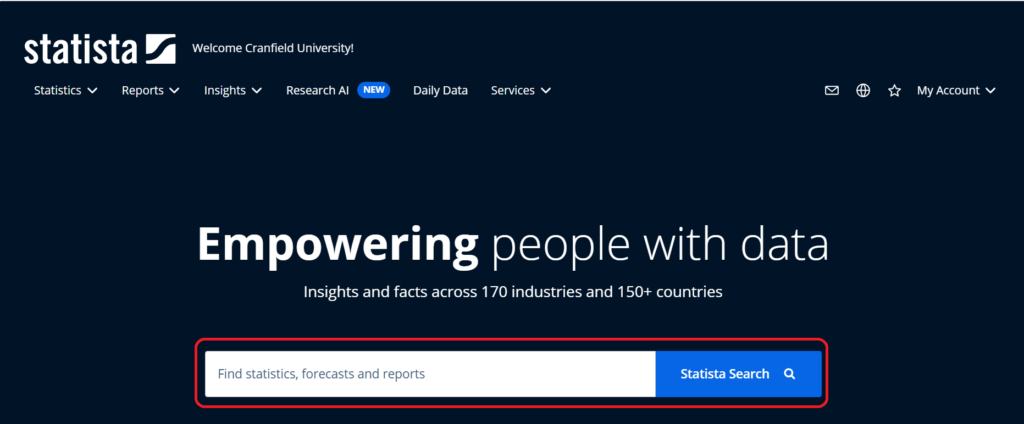
Just add your keywords to the search bar. You can also use simple Boolean logic (AND, OR, NOT, which must be in capitals) to refine your search.
To narrow down your search results, use tags and filters:
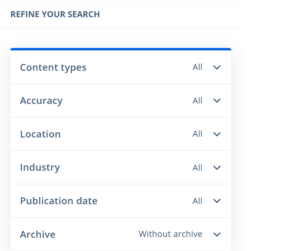
- Filters: Use the sidebar with multiple options to narrow down search results. You can apply filters based on criteria such as content type, location, industry, publication date, and more.
- Tags: These are keywords or labels assigned to content that help categorise it by specific topics or categories. Click on a tag to filter the current search results and display only content relevant to that tag.
Content type:
Statista offers various content types to suit your needs. You can use these from the dropdown menus at the top of your screen, or, once you’ve completed your search, from the filters sidebar menu. In your results list you can also see that each search result is categorised as one of these content types above the title:
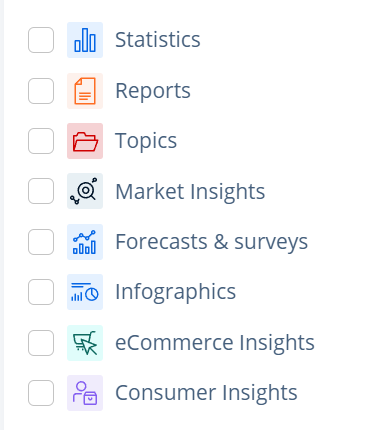
- Statistics: This is a piece of statistical data. There are over 1 million statistics on 80,000 different topics from more than 22,500 sources.
- Reports: These provide information on various markets and industries and cover the latest and most important issues in a condensed format. Content is processed by Statista editors based on reliable data from independent analysts.
- Topics: These cover an initial overview of all content including statistics, key insights and reports for over 80,000 topics, so are an ideal starting point for your research.
- Market Insights: These provide easy-to-use data on over 1,000 markets and industries to identify market potential. The Insights show historical data that goes as far back as 10 years and a forecast for the upcoming 5 years, which enables you to discover trends early on. Want to know more about this area of Statista? Check out YouTube video on Market Insights
- Forecasts & Surveys: Forecasts – relevant data on market trends for about 400 industries in around 40 countries. Statista experts develop a detailed market model, based on which the future market size is calculated. Surveys – data from exclusive quantitative online and telephone surveys among consumers and industry experts worldwide, conducted by Statista.
- Infographics: Easy and appealing visualizations of topical events.
- Consumer Insights: These Insights help you understand consumer behaviour as well as consumer interactions with brands. The results of a Statista online survey about the attitudes and behaviours of a broad consumer base from various countries can be analysed directly via the interactive online tool. The survey provides data about different industries and topics, which can be combined in cross tabs and individual target groups, enabling an analysis according to your requirements. Want to know more about this area of Statista? Check out YouTube video on Consumer Insights
- eCommerce Insights: this area is not covered in our subscription
Statistics:
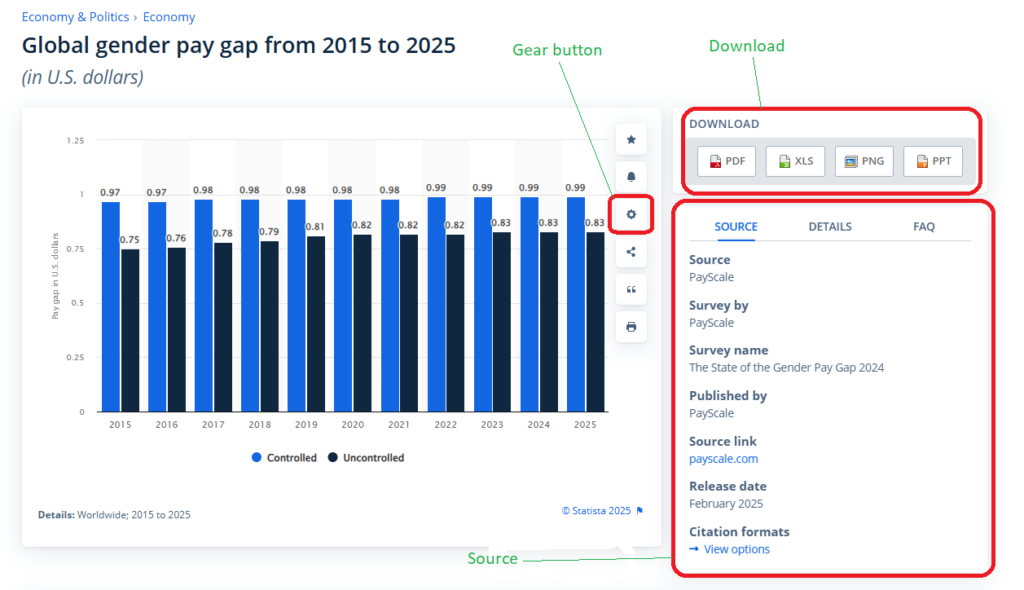
- Gear Button: Use this to configure the presentation of a statistic. Choose between a bar or line chart, or a data table. You can also customise data labels to avoid overcrowding. Remove individual labels by clicking on them before downloading the statistic by selecting Custom.
- Download: Download statistics in different formats by clicking on one of the buttons for the different formats located to the right of the statistic: PNG, PDF, XLS and PPT.
- Sources: information regarding the origin of the data, distinguishing between the source, the publisher and the conductor of the survey.
- source – directly view the source of the data and who conducted the survey. It will include a hyperlink if the source is available as an online source. Hint: following these links can be a good way of tracking down more or updated information on your area of interest.
- details – information about the region and the survey time period.
- FAQ – e.g. why it is possible that you can’t see some content.
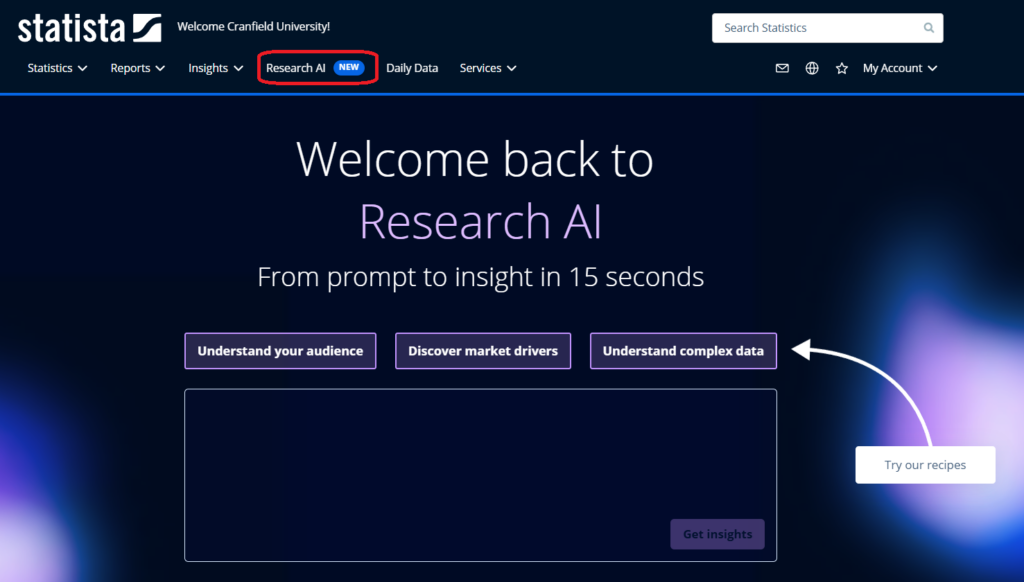
Research AI:
Statista’s AI tool is a great resource for your research and you can be confident that a human researcher has checked the quality of the source information. What makes it good?:
- Curated searches: Searches within Statista resources only, ensuring quality and reliability.
- Honest responses: If Statista doesn’t have the data to answer your query, the response will tell you that, and will suggest related conclusions based on available data.
- Source transparency: You’ll always see the Statista sources used to create the response so you can interrogate them yourself.
- Unlimited questions: There are no restrictions on the number of questions you can ask.
- Further recommendations: Suggestions include ways to extend your query and more curated content.
How to use Research AI: Just choose it from the menus at the top of the page, type your question in the box and click on ‘Get Insights’. If you need some suggestions for your prompt (the question that you ask) click on the ‘Go to research AI’ button under the box.
If you’ve got any questions about Statista, or about more general searching for information to support your work, please get in touch with us at library@cranfield.ac.uk.
Feature image from Pixabay. Available at: https://pixabay.com/illustrations/ai-generated-dashboard-statistics-8615473/
Categories & Tags:
Leave a comment on this post:
You might also like…

Using AI tools for your literature review
There are a proliferation of AI tools that can help you organise your life, work and study. This post focuses on academic or scholarly tools that have been developed to enhance the literature searching process, whether for independent research, an assignment or thesis. Bear in mind that these predominantly relate to finding journal/research papers, and not technical, business or trade sources such as standards, market research, industry reports or financial data. So ...

Finding successful past Cranfield theses
It’s always a good idea to look at examples of theses before you start work on your own. You may find them valuable for reading previous research, and for looking at structure, style and methodology. ...

On‑campus or off‑campus? How Cranfield students found their home away from home
Finding the right place to live is one of the biggest decisions you’ll make as you begin your student journey. Whether you’re looking for the convenience and community of living on-campus or the independence ...

Avoiding common referencing errors
As librarians, we get to see the full spectrum of reference lists in student work —from exemplary to … well, let’s just say, works still very much in progress! We are experts in spotting mistakes ...

Using your Mendeley library after you have left Cranfield
So you have spent the whole year (or more) lovingly collecting references around the topics that matter to you and now you have a large, personalised library in Mendeley Reference Manager containing all that information. ...

Referencing the use of generative AI in your work
We recognise that Artificial Intelligence (AI) has, and will increasingly, become a part of our everyday lives and that we need to adapt to it. Hopefully you will have already seen the guidance for staff ...
Comments are closed.