


A muddy river in a bigger picture
11/07/2019

Two years ago I completed my PhD at Cranfield University. Now, after a postdoc at University of Leeds, I am back at Cranfield working on a NERC-funded project on social-economic-environmental trade-offs in managing the land-river interface. The start of my new job at Cranfield coincided with the publication of the last paper of my PhD, called “Temporal variation in suspended sediment transport: linking sediment sources and hydro-meteorological drivers”. So, before getting into the exciting details of the new project, let’s talk about sediment!
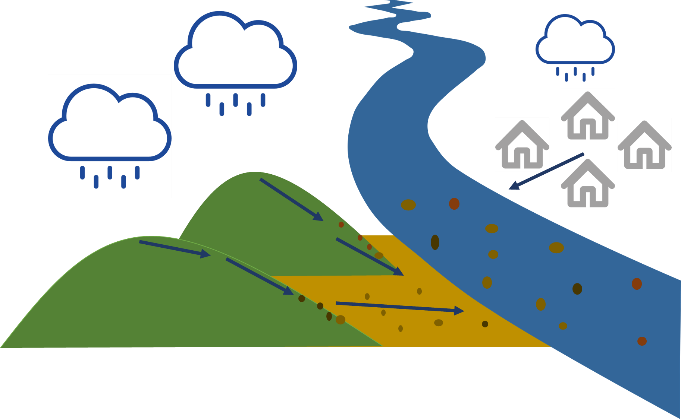
What do we mean by suspended sediment? Well, basically, when it rains and water falls onto the earth’s surface, it can cause very fine particles (from different surfaces, such as soils and streets) to be transported together with the flowing water towards the river. Once the particles are in the river, we call it sediment. Sediment is an important aspect of rivers, as these particles carry nutrients from the land and they form the building blocks of aquatic habitats. However, too much sediment can also cause problems to these habitats, and sediment particles are also known to carry pollutants. Therefore, scientists and river managers are very much interested in understanding sediment transport in rivers.
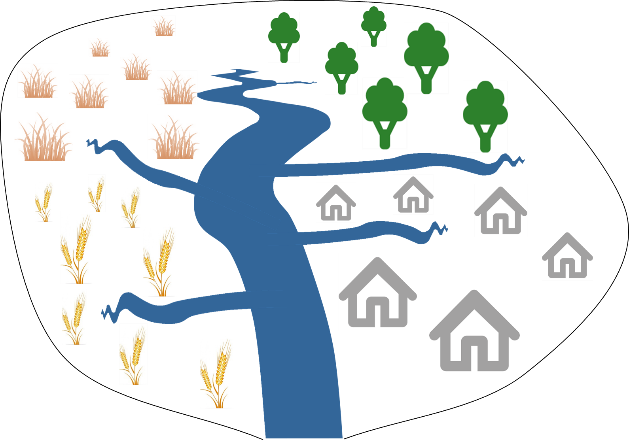
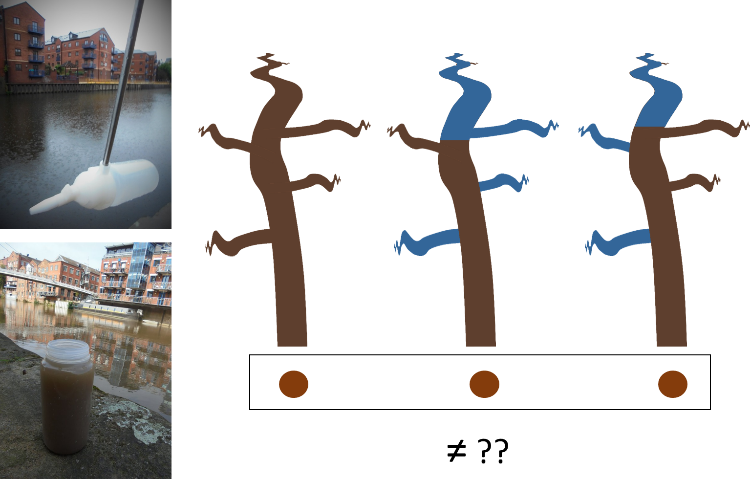
Let’s now zoom out a bit and look at an entire river catchment that consists of four types of land use (grassland, forest, agriculture, urban). Suppose it starts raining and particles are being transported from land towards the river from all across the catchment (situation 1). As a result of this, we get a mixture of sediment coming from the surface of the four types of land use. Alternatively, when it is only raining in the upper left part of the catchment, we get mainly particles from the grassland area (situation 2), while only rain in the right part of the catchment will mainly cause particles from forest and urban area to be transported to the river (situation 3).
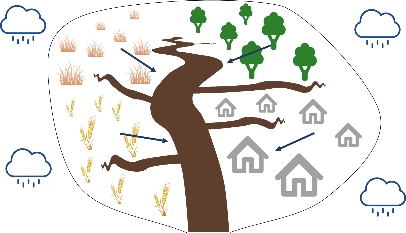

Situation 2: rainfall in upper left part of the catchment
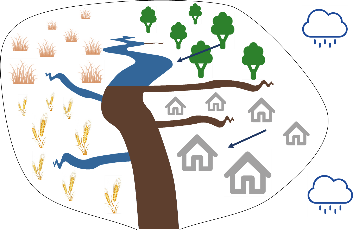
Situation 3: rainfall in right part of the catchment
In each of these three situations, the amount and source of the sediment will be different. However, if we take a sediment sample at the outlet of the river catchment in each of these situations, we can calculate how much sediment is in our sample, but we cannot actually see where the sediment comes from. From the mixed sediment sample, we simply cannot see what the main sources of the sediment are.
Why would we want to know the source of the sediment? Understanding how much sediment there is in the river, where it comes from, and how it varies over time as a result of variations in rainfall, provides very important information that can help us better predict and monitor fine sediment in rivers and develop targeted management strategies. But because sediment studies in rivers are based on the mixed sediment samples, we miss important information about the bigger picture (catchment).
That is why our recently published paper applied a technique called “sediment fingerprinting”, which basically aims at identifying the sources of sediment in a mixed sample. The technique characterises sediment from the different sources (land use types) (which we did using Infrared Spectroscopy), and then include these characteristics into a statistical model to “un-mix” our samples into the contributions of the sources.

Identifying the sediment fingerprint of each sediment source

Un-mixing sediment sample in contributions of sediment sources with statistical model
We applied this technique to the River Aire in Leeds (UK) to identify the most important sediment sources of fine sediment in the River Aire, and most importantly, investigate how these sources vary over time as a result of variations in rainfall and river flow. By linking information obtained through sediment fingerprinting with detailed rainfall and river discharge data, we were able to construct a bigger (sediment) picture for the River Aire catchment.
Categories & Tags:
Leave a comment on this post:
You might also like…

Using AI tools for your literature review
There are a proliferation of AI tools that can help you organise your life, work and study. This post focuses on academic or scholarly tools that have been developed to enhance the literature searching process, whether for independent research, an assignment or thesis. Bear in mind that these predominantly relate to finding journal/research papers, and not technical, business or trade sources such as standards, market research, industry reports or financial data. So ...

Finding successful past Cranfield theses
It’s always a good idea to look at examples of theses before you start work on your own. You may find them valuable for reading previous research, and for looking at structure, style and methodology. ...

On‑campus or off‑campus? How Cranfield students found their home away from home
Finding the right place to live is one of the biggest decisions you’ll make as you begin your student journey. Whether you’re looking for the convenience and community of living on-campus or the independence ...

Avoiding common referencing errors
As librarians, we get to see the full spectrum of reference lists in student work —from exemplary to … well, let’s just say, works still very much in progress! We are experts in spotting mistakes ...

Using your Mendeley library after you have left Cranfield
So you have spent the whole year (or more) lovingly collecting references around the topics that matter to you and now you have a large, personalised library in Mendeley Reference Manager containing all that information. ...

Referencing the use of generative AI in your work
We recognise that Artificial Intelligence (AI) has, and will increasingly, become a part of our everyday lives and that we need to adapt to it. Hopefully you will have already seen the guidance for staff ...