


Finding consumer information in Passport
04/04/2024

So, you’re researching the Mexican consumer market. You’ll want to really understand what Mexican people are thinking and how they are living. One of the best places to look is Passport’s Consumer information, and its Consumer Lifestyles Reports are a great place to start….
Want to know how to find these Lifestyle Reports?
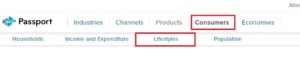
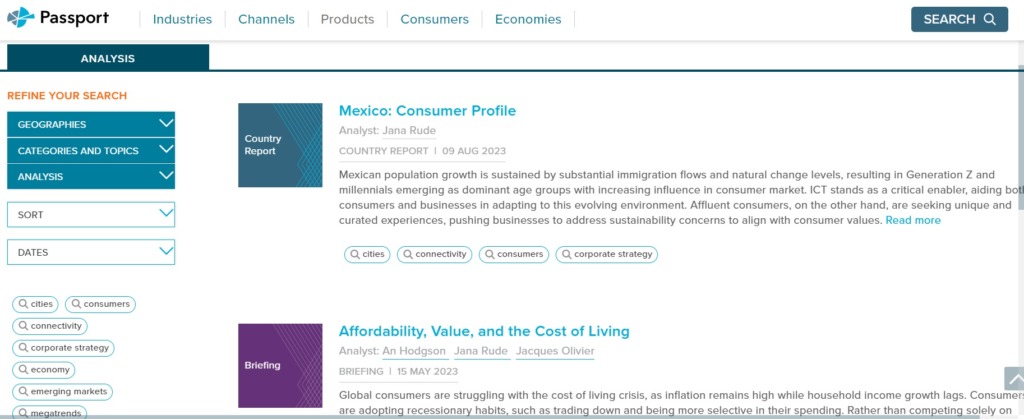
Start at the Passport homepage. Click on ‘Consumers’ near the top of the screen, then click on ‘Lifestyles’ from the sub-menu that has appeared.
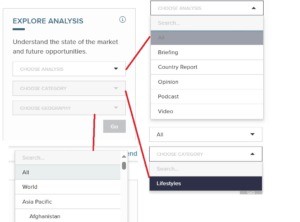
You now have some dropdown menus on the left of the screen in the ‘Explore Analysis’ box.
- In the ‘Choose Analysis’ dropdown box, pick All.
- In the ‘Choose Category’ dropdown menu pick ‘Lifestyles’
- In the ‘Choose Geography’ dropdown menu you can either search for Mexico in the search box then pick it off the list, or scroll down the list – Mexico will be under Latin America – and pick it.
- Click ‘Go’.
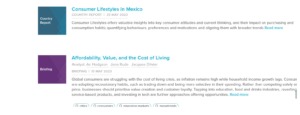
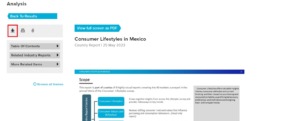
You’ve got a list of reports. Scroll down to find, and click on, ‘Consumer Lifestyles in Mexico’ report.
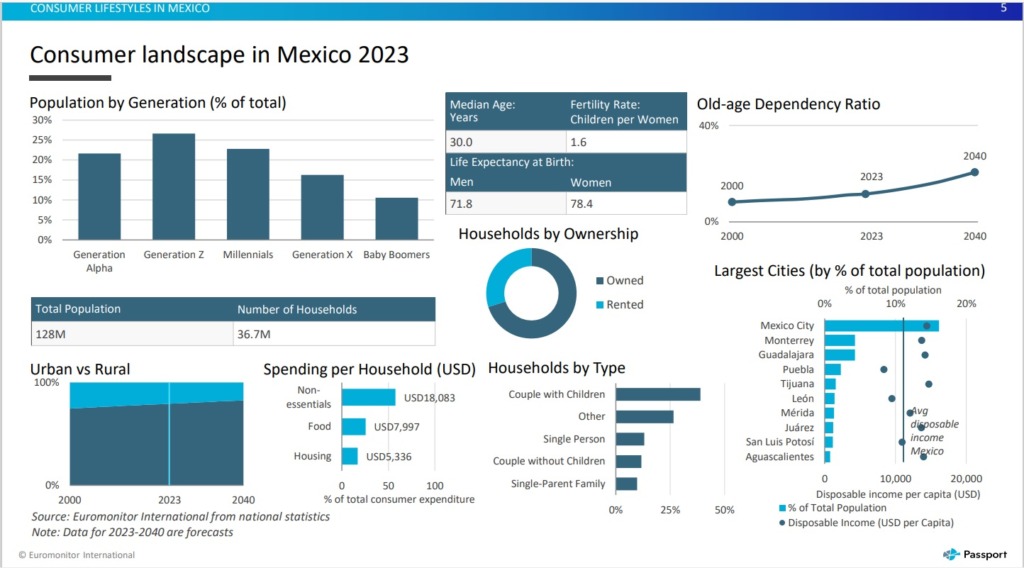
Generally published on an annual basis, Consumer Lifestyles reports start off with the latest Consumer Landscape datagraphic and move on to report on the following key areas:
- Personal traits and values
- Home life and leisure time
- Eating and dietary habits
- Working life
- Health and wellness
- Shopping and spending
You can view the report on screen, or download it as a PDF or Powerpoint. You can also choose to print it.
Do you need consumer income and expenditure information too?
Passport can help with this as well! Using Passport, you can explore how spending on consumer goods and services varies across households’ income levels.
Start in the same place by clicking on ‘Consumers’ in the top menu. This time click on ‘Income and Expenditure’.
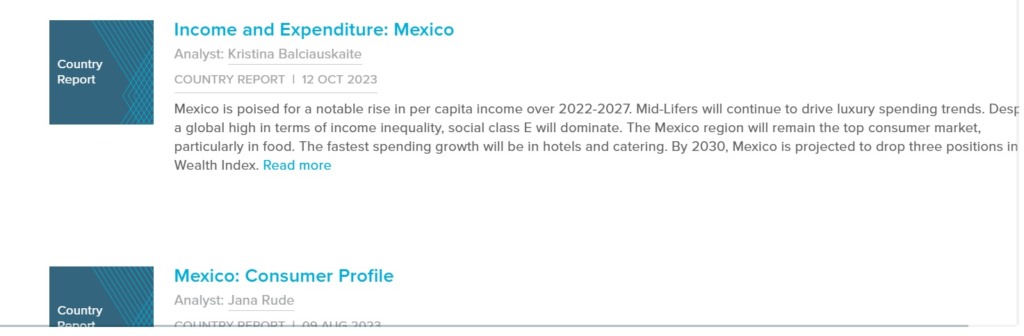
You will see the dropdown menus again. Instructions remain the same except pick ‘Income and Expenditure’ from the ‘Choose Category’ menu. Now you have a list of reports, click on ‘Income and Expenditure: Mexico’ report.
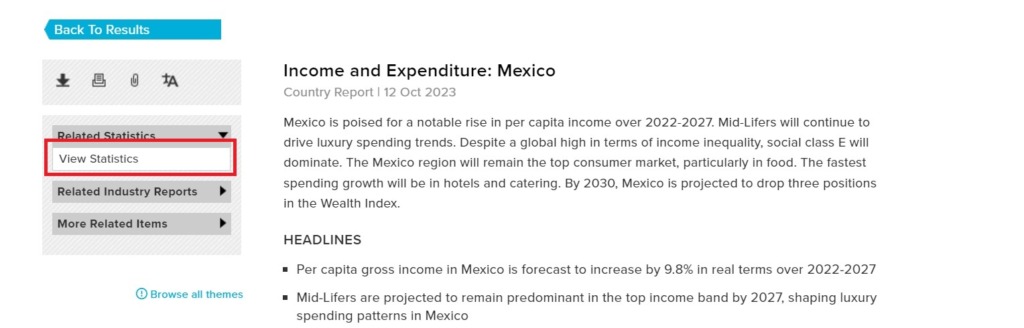
For this report, you can also view income and expenditure statistics – just choose ‘view statistics’ from the menu on the left.
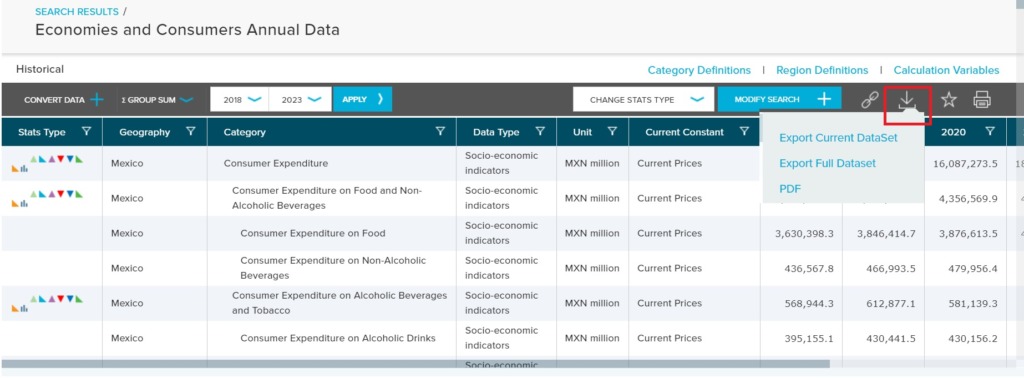
You can make a number of changes to the statistics being shown, including changes to currency, date range, and type of statistics. You can download these statistics to PDF or export them to Excel.
What about population data?
Yes, you’ve guessed it, Passport has that too! This time, once you’ve clicked on ‘Consumers’ in the top menu, you need to click on ‘Population’.
Again you will see the dropdown menus on the left and, again, the instructions remain the same with the only change being to pick ‘Population’ from the ‘Choose Category’ menu.
You may not see a report with population in the title, but a ‘Consumer Profile’ report will include population information.
It may also have some statistical data, which can be chosen from the menu on the left. You will be able to change some aspects of the data that you see and download it to excel, if that’s what you require.
Passport is a market research database which provides detailed data and analysis on industries and consumers, across 1200 cities, 210 countries. It uses advanced analytics and data science to identify and measure the effect of disruption to the economy, industries, costs and prices.
Passport is our main source of consumer information, but other sources include Mintel and Statista
If you have any questions about Passport, then please contact the Library.
Categories & Tags:
Leave a comment on this post:
You might also like…

Building more than research: Reflections from the ECRn Symposium 2026
There’s something quietly powerful about a room full of early career researchers. Not just the ideas, although there were plenty of those—but the conversations, the curiosity, and the sense that everyone is figuring things ...

Library services over Easter, 3-6 April
Kings Norton Library will remain open for study 24/7. You will need your University ID card to enter the building and can use the self-service machines to borrow and return items as usual. Barrington Library ...

How do I access the full-text of Harvard Business Review (HBR)?
This is a frequently asked question, and it's worth knowing how to access this key management journal. So, how do you access HBR in full-text? The short answer is via our eJournals finder. You can find ...

Engineering problem to solve? Let Knovel help you find a solution
Did you know that Knovel provides you with more than just eBooks? Knovel is a key database for many engineering, mechanical and materials courses here at Cranfield University, and contains content from an extensive range ...

What happens when female scholars meet influential leaders?
On the 5 March 2026, our British Council Women in STEM Scholars had the privilege of sitting down with two excellent role models of industry and academia: Professor Dame Karen Holford, ...

From MSc to CEO: Igniting a research revolution
For many, a master’s degree is achieving a big milestone. Kilyan Ocampo, Computational Fluid Dynamics alumni shares how studying at Cranfield helped launch his career in the energy sector. Today, Kilyan ...
Comments are closed.