


Sourcing industry and economic data in BMI
16/06/2024
")
BMI (formerly FitchConnect) users, have you tried out the data export function?
In case you don’t know… in addition to its country and industry reports, BMI includes a huge data bank of macroeconomic and industry data, available for download and manipulation.
Here, to demonstrate how easy it is, we will chart the nominal GDP per capita for the last ten years plus five years of forecasts for the MINT countries: Mexico, Indonesia, Nigeria and Turkiye (Turkey). For comparison purposes we will opt to display the data in US$.
Getting started:
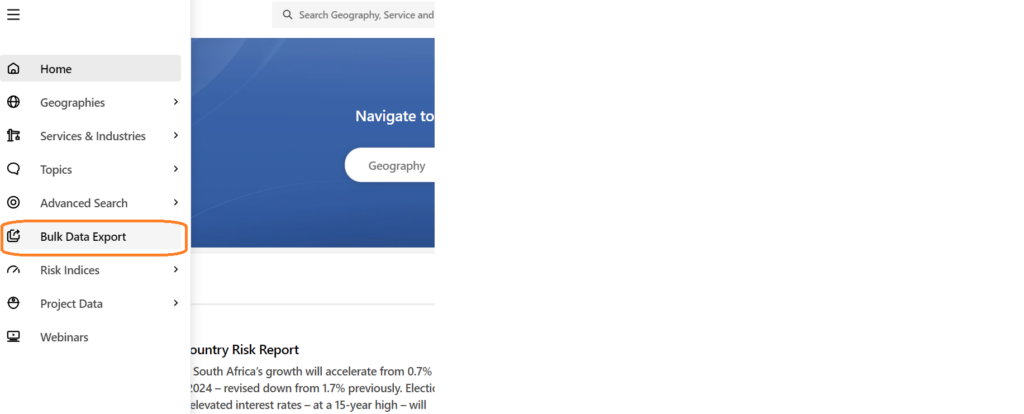
To begin, select the ‘Bulk Data Export’ option from the left hand menu.
Selecting your data is an easy 4-step process using the options in the left hand panel.
Step 1: Select your Geographies:
Select the country or countries you require from the Geographies options. Within Geographies you can either browse by continent using the > icons or search using the ‘Find a Geography’ box.
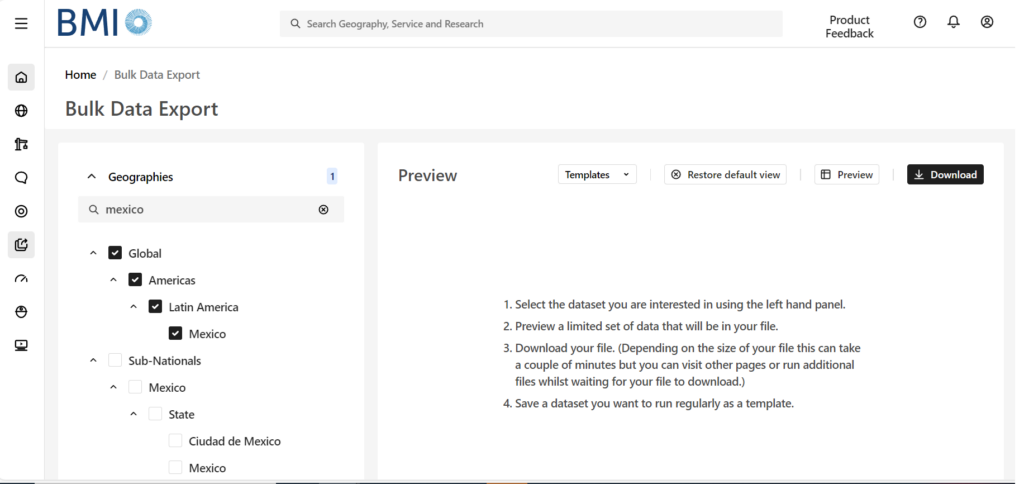
Remember to select each of the countries you require using the check-boxes before you move to the next step. The number of countries selected should be displayed next to the Geographies heading.
Step 2: Select your Data Item(s):
Now click on ‘Data Items’ to select the specific data you want to use. BMI contains a databank of more than 2.7 million lines of data covering both industrial markets and macroeconomic data. For GDP, we will need the ‘Macro Economic’ menu. Open it using the > icon next to the title.
Wherever you see the > icon, you can open further sub-menus to drill further into the data. If you are unsure of where to find the data items you require, search for them using the ‘Find a Data Item’ box.
Hovering over the ‘i’ icon will give you the definition for a dataset.
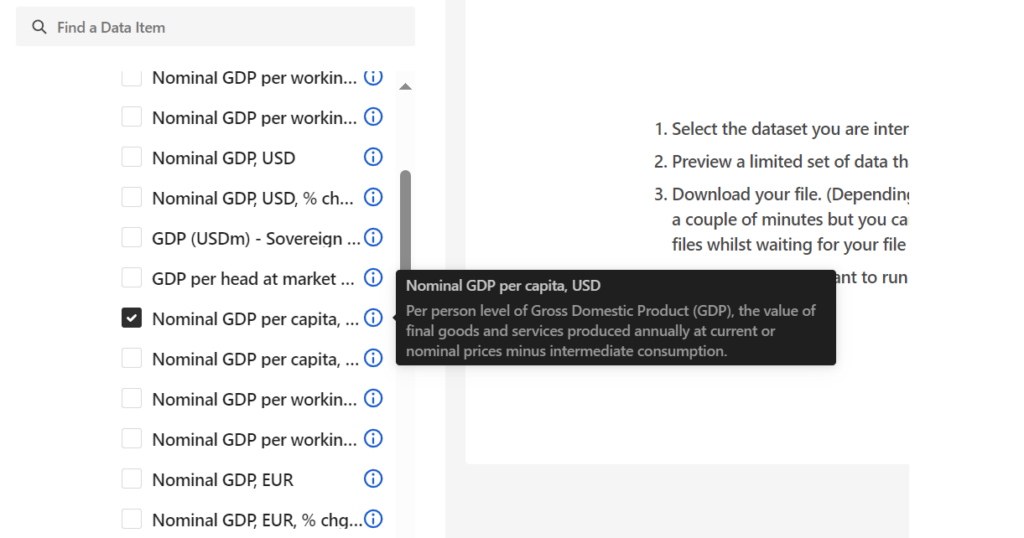
Select your dataset option(s) then scroll down to open the date range menu.
Step 3: Select Date Range:
Select your data range and frequency. Data may be reported monthly, quarterly or annually so you may have to select your preferred option. Be aware that most data is only reported on an annual basis. Depending on the datasets you have selected, your options here may vary. Where forecasts are available, BMI will allow you to select future dates.
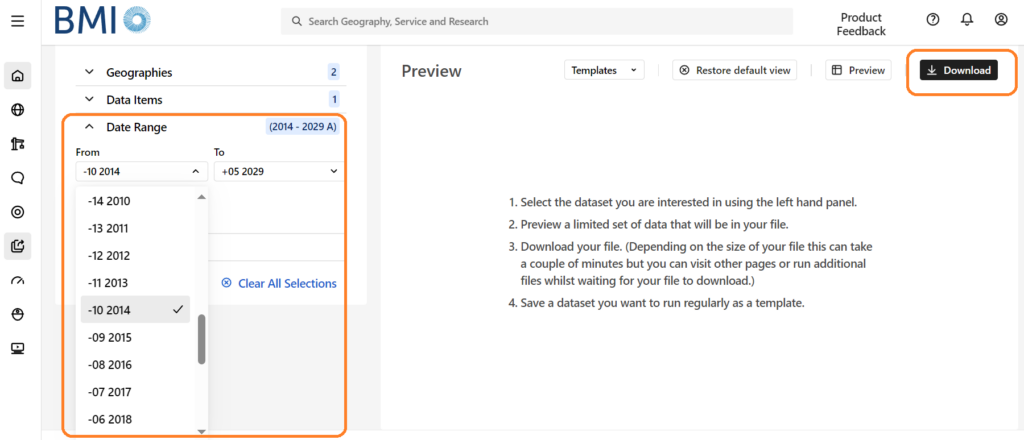
From here, you can preview your dataset or download data directly to Excel via the options at the top right.
If you are interested in downloading and charting data, you may also want to read our post on Finding economic data in Passport.
If you have any questions about downloading data or charting within our resources, feel free to contact the Library
Categories & Tags:
Leave a comment on this post:
You might also like…

Driving the future of automotive excellence with three new scholarships
Cranfield University has a long history within the top echelon of motorsport, car development and safety designs within the automotive industry, working in the era where we’ve seen significant safety improvements, engineering feats and ...

Academic writing and being critical
Academic writing is daunting. Capturing all your thoughts and analysis and putting them down onto paper in some sort of understandable fashion is a challenge. Did you know we have resources in our Cranfield Study ...

My Cranfield experience: How studying for the Strategic Marketing MSc landed me a job in my dream industry
For Shraddha Mahapatra, studying for a postgraduate master’s degree at Cranfield School of Management unlocked the path to a career working in her dream industry sector. Shraddha had gained an MBA in her native ...

Keen to develop your study skills?
Alongside the technical skills and academic knowledge that you will gain on your course, as a Cranfield student you have the opportunity to develop a range of other skills that can enhance your learning experience. ...

From classroom to reality: Supply chain insights from Cranfield’s Manchester study tour
Each year, Cranfield University organises a study tour for MSc Logistics and Procurement & Supply Chain Management students. For the 2025–2026 cohort, students were given the option to select one of three study groups: ...

Systematic literature review – Managing duplicates
One of the questions which often comes up when discussing the SLR process is how do I manage my references in the most efficient way during the process of going from my search results to ...