


Performance Reporting Measures vs Performance Management Measures – Part 2
05/12/2019

Another Problem with % Measures
You may have read my blog from last week comparing Performance Reporting Measures vs Performance Management Measures.
Performance reporting is littered with measures that may appear to carry meaning for some people, but in our observations, have been misleading and impenetrable to many. And certainly don’t help understanding nor how to improve!
Here are some examples of reporting measures that we introduced previously:
- % items completed: % implies a ratio – with a numerator and denominator. E.g. % Repairs Completed defined by (Number of Repairs Completed / Total Number of Repair Calls) * 100
- % completed within some timeframe: E.g. From a previous blog’s A&E Figures, we saw % A&E attendants seen in 4 hours or under.
- Complicated Measure Combinations: E.g. % Forecast Accuracy in Supply-chain
- Applying sophisticated statistical treatment to raw performance measures that only stats specialists can read: E.g. Exponentially weighted moving averages
- Statistical representation of a population of people or things: E.g. Electric Car Use by Country
There’s one more critical problem with % measures I didn’t mention last time. And this one is particularly mind-bending, even to some of those who have studied Maths!
You start to stumble across the problem when you start drilling down into sub-sets of the data to “better understand what is going on”. So, for example, regarding A&E data, you may want to drill down by hospital and by age-group. You do this at your peril!
But, to keep this light, we’ll select an alternative example from Wikipedia that you can all go take a look at – batting percentages over two years for two baseball players. We could have picked a cricketing example, but who knows what’s happening in the Test in New Zealand right now – well I said I wanted to keep this light!
So here are the baseball figures – the figures are (number of hits) / (number of “at bats”):
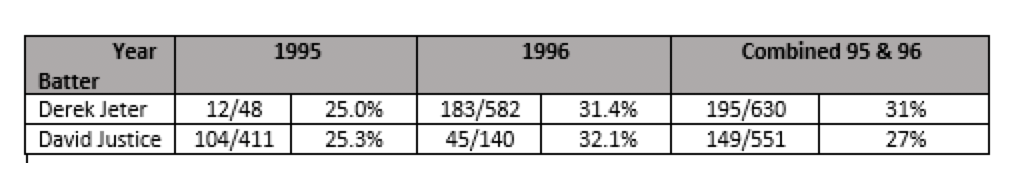
So looking at the individual year’s batting % in each of 1995 and 1996, you’d want to bet on David Justice. BUT! When you look at their combined % for the 2 years, you’d want to go with Derek Jeter. Confused?
I won’t explain this paradox here, since Wiki does a very good job of it – but it is well-known (to some mathematicians and stats guys) as Simpson’s Paradox. It happens because both the numerator and denominator can vary independently.

The ONLY way to resolve this is to have a clear PURPOSE for the business process (Wiki refers to STORY), which will guide the reader on whether to use the aggregated % or the component %s, OR to use an alternative measure altogether.
And I’m pretty sure Dilbert would encourage you to look at the underlying raw data – i.e. number of “at bats” and the “hits” separately (instead of, or, worst case, as well as %’s) if you really want to understand what’s happening!
Categories & Tags:
Leave a comment on this post:
You might also like…

Driving the future of automotive excellence with three new scholarships
Cranfield University has a long history within the top echelon of motorsport, car development and safety designs within the automotive industry, working in the era where we’ve seen significant safety improvements, engineering feats and ...

Academic writing and being critical
Academic writing is daunting. Capturing all your thoughts and analysis and putting them down onto paper in some sort of understandable fashion is a challenge. Did you know we have resources in our Cranfield Study ...

My Cranfield experience: How studying for the Strategic Marketing MSc landed me a job in my dream industry
For Shraddha Mahapatra, studying for a postgraduate master’s degree at Cranfield School of Management unlocked the path to a career working in her dream industry sector. Shraddha had gained an MBA in her native ...

Keen to develop your study skills?
Alongside the technical skills and academic knowledge that you will gain on your course, as a Cranfield student you have the opportunity to develop a range of other skills that can enhance your learning experience. ...

From classroom to reality: Supply chain insights from Cranfield’s Manchester study tour
Each year, Cranfield University organises a study tour for MSc Logistics and Procurement & Supply Chain Management students. For the 2025–2026 cohort, students were given the option to select one of three study groups: ...

Systematic literature review – Managing duplicates
One of the questions which often comes up when discussing the SLR process is how do I manage my references in the most efficient way during the process of going from my search results to ...