


Performance Reporting Measures vs Performance Management Measures – Part 2
05/12/2019

Another Problem with % Measures
You may have read my blog from last week comparing Performance Reporting Measures vs Performance Management Measures.
Performance reporting is littered with measures that may appear to carry meaning for some people, but in our observations, have been misleading and impenetrable to many. And certainly don’t help understanding nor how to improve!
Here are some examples of reporting measures that we introduced previously:
- % items completed: % implies a ratio – with a numerator and denominator. E.g. % Repairs Completed defined by (Number of Repairs Completed / Total Number of Repair Calls) * 100
- % completed within some timeframe: E.g. From a previous blog’s A&E Figures, we saw % A&E attendants seen in 4 hours or under.
- Complicated Measure Combinations: E.g. % Forecast Accuracy in Supply-chain
- Applying sophisticated statistical treatment to raw performance measures that only stats specialists can read: E.g. Exponentially weighted moving averages
- Statistical representation of a population of people or things: E.g. Electric Car Use by Country
There’s one more critical problem with % measures I didn’t mention last time. And this one is particularly mind-bending, even to some of those who have studied Maths!
You start to stumble across the problem when you start drilling down into sub-sets of the data to “better understand what is going on”. So, for example, regarding A&E data, you may want to drill down by hospital and by age-group. You do this at your peril!
But, to keep this light, we’ll select an alternative example from Wikipedia that you can all go take a look at – batting percentages over two years for two baseball players. We could have picked a cricketing example, but who knows what’s happening in the Test in New Zealand right now – well I said I wanted to keep this light!
So here are the baseball figures – the figures are (number of hits) / (number of “at bats”):
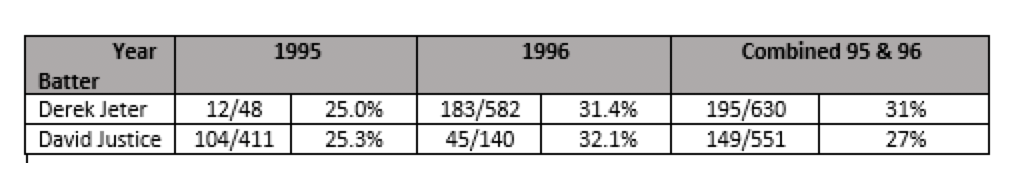
So looking at the individual year’s batting % in each of 1995 and 1996, you’d want to bet on David Justice. BUT! When you look at their combined % for the 2 years, you’d want to go with Derek Jeter. Confused?
I won’t explain this paradox here, since Wiki does a very good job of it – but it is well-known (to some mathematicians and stats guys) as Simpson’s Paradox. It happens because both the numerator and denominator can vary independently.

The ONLY way to resolve this is to have a clear PURPOSE for the business process (Wiki refers to STORY), which will guide the reader on whether to use the aggregated % or the component %s, OR to use an alternative measure altogether.
And I’m pretty sure Dilbert would encourage you to look at the underlying raw data – i.e. number of “at bats” and the “hits” separately (instead of, or, worst case, as well as %’s) if you really want to understand what’s happening!
Categories & Tags:
Leave a comment on this post:
You might also like…

Using AI tools for your literature review
There are a proliferation of AI tools that can help you organise your life, work and study. This post focuses on academic or scholarly tools that have been developed to enhance the literature searching process, whether for independent research, an assignment or thesis. Bear in mind that these predominantly relate to finding journal/research papers, and not technical, business or trade sources such as standards, market research, industry reports or financial data. So ...

Finding successful past Cranfield theses
It’s always a good idea to look at examples of theses before you start work on your own. You may find them valuable for reading previous research, and for looking at structure, style and methodology. ...

On‑campus or off‑campus? How Cranfield students found their home away from home
Finding the right place to live is one of the biggest decisions you’ll make as you begin your student journey. Whether you’re looking for the convenience and community of living on-campus or the independence ...

Avoiding common referencing errors
As librarians, we get to see the full spectrum of reference lists in student work —from exemplary to … well, let’s just say, works still very much in progress! We are experts in spotting mistakes ...

Using your Mendeley library after you have left Cranfield
So you have spent the whole year (or more) lovingly collecting references around the topics that matter to you and now you have a large, personalised library in Mendeley Reference Manager containing all that information. ...

Referencing the use of generative AI in your work
We recognise that Artificial Intelligence (AI) has, and will increasingly, become a part of our everyday lives and that we need to adapt to it. Hopefully you will have already seen the guidance for staff ...