


How do I reference images, diagrams, charts and tables… in the Cranfield Author-date style?
18/04/2015

Have you found an image or chart that you would like to reproduce in your report or assignment? If so, you’ll need to know how to correctly cite and reference it.
How to cite figures
A figure may be any diagram, chart, image or photograph. If you decide to use a figure in your work, you will need to number it and include details of the source (the author, date, and page number if available) directly below the image itself.
For example:
Figure 1: Attitudes towards and usage of selected brands, January 2015 and November 2014
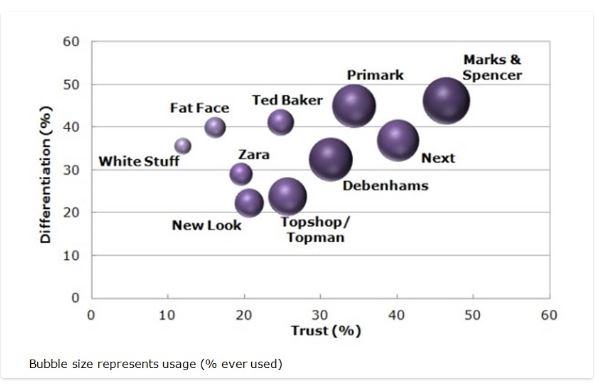
Source: Mintel (2015)
You will also need to include a full bibliographic reference at the end of your work:
Mintel (2015) Menswear – UK. March. Available at: http://academic.mintel.com/. (Accessed 26 March 2015).
How to cite tables
As with figures, if you are using a table in your work, you will need to number it and include the source information below the image.
For example:
Table 1: United States, Total GDP 2009-2014
![]()
Source: Euromonitor International (2015)
You will also then need to include a full bibliographic reference at the end of your work:
Euromonitor International (2015) United States, Total GDP 2009-2014. Available at: http://www.portal.euromonitor.com/. (Accessed 26 March 2015).
If you have taken data from one of the MIRC resources and developed it in some way you will need to indicate this in your in-text citation:
Source: Adapted by the author from Datastream
Source: Author, based upon data taken from FAME and Bloomberg.
Remember to also include a bibliographic reference for each source following the example above. As always if you have any questions about referencing, please contact us.
Feature image from Pixabay. Available at: https://pixabay.com/photos/analysis-analytics-business-charts-1841158/
Categories & Tags:
Leave a comment on this post:
You might also like…

A beginner’s guide to sourcing a company beta
Beta is the measurement of a company’s common stock price volatility relative to the market. If you’re trying to find a current beta for a company there are a number of places to look. These ...

Credibility, confidence and collaborative focus: The impact of studying for a sustainability apprenticeship at Cranfield
For participants on Cranfield’s Sustainability Business Specialist Apprenticeship, it doesn’t take long for their studies to start to have an impact, with that impact ranging from personal growth and career progression, to organisational effect ...

Meet Mendeley: a powerful referencing tool that does the hard work for you!
Are you looking for a way to manage your references, create in-text citations and reference lists for your assignments or thesis? If so, you may wish to consider using Mendeley. What is it? Mendeley is ...

Adding documents to your Mendeley account
To make the most of a Mendeley account, it is useful to create and maintain a ‘Library’ of references. You can add references and documents to this Library in a number of ways: 1) Drag ...

Choosing the right reference management tool for you…
Are you thinking about using reference management software to help you manage your references? The Library is here to help you. While Mendeley has been our go-to reference management software for some years, we've recently ...

Cranfield Seed Fund recipient, Cosysense, are using AI to solve air conditioning problems and provide a net zero alternative
If you’ve ever worked in an office environment you’ve probably been involved in, or overheard, a conversation about the air conditioning. Well, it’s no surprise it’s a common complaint when research shows that up ...