


From stars and stripes to hazards and risk assessments
08/11/2018
I can’t stress enough how much I’m enjoying myself at Cranfield. Not only do I love what I’m studying (Environmental Engineering MSc), I love the way it’s taught. It’s so different from coursework in the USA, and I think that makes it perfect. In the USA, you have 5 classes a day, at least 3 times a week, with assignments and tests spread just enough throughout that you don’t pass out from exhaustion. If you ask me what I learned from the last time I tried to earn a Master’s degree, I can only tell you college is too expensive and I hate snowploughs that show up at 4 am.
But after only my first week at Cranfield, I’ve already bored my fiancée to death with what I’ve learned about hazards and risk assessments. Now, I’ve had some experience with this subject before as I used to work in a nuclear waste facility. I’ve seen that consequence vs. likelihood chart. One of the reading list articles mentioned a DOE standard for risk that I’ve spent 5 years working with. But I still walked away with something.
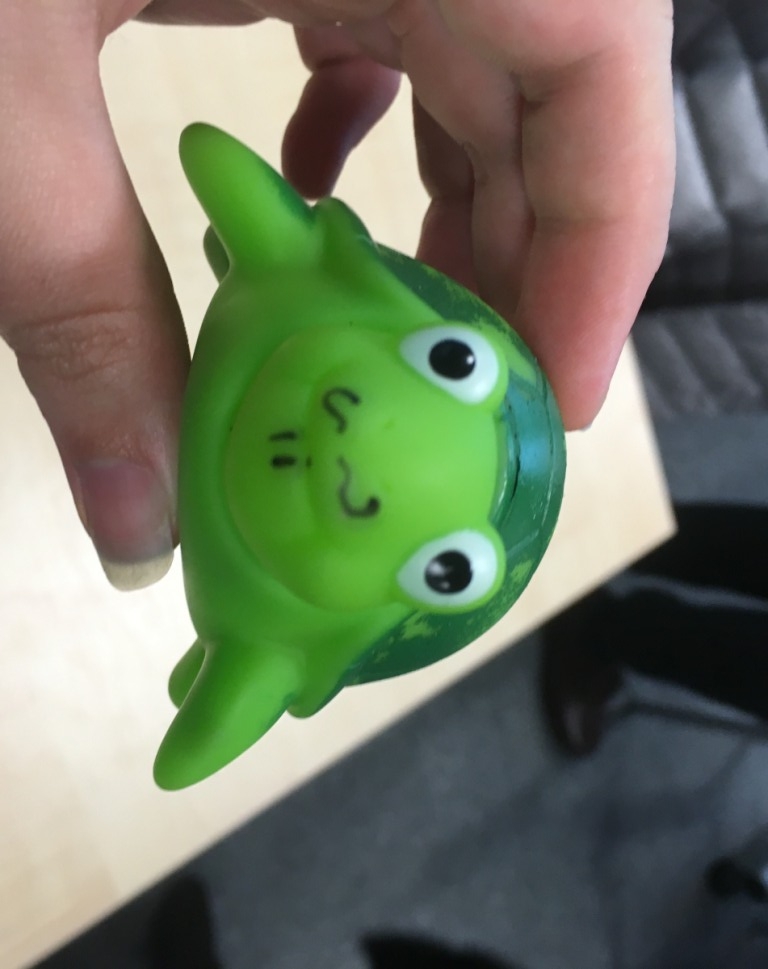
The course started out with about two – three days of discussion covering everything we needed to know about the process of risk assessment. I barely had to take notes because the slides had everything laid out in an extremely easy to understand way. I don’t think you could make it simpler or better, and we weren’t just talked at all day long. The teachers did a great job of connecting us to the material with mini projects and interactive group projects. Things got really intense the last two days. It was sink or swim. And while frustrating and daunting, I loved every second of it. The stress toys given to us us (see picture above) by our lecturer helped too! You not only got to practice applying what you were learning, but you got feedback and a chance to discover what you didn’t understand or forgot. Friday was particularly helpful. We did a risk assessment in one day, step by step. And since we were in groups, we got to see a variety of ways to approach the problem, with feedback on which way was more helpful. It was awesome!
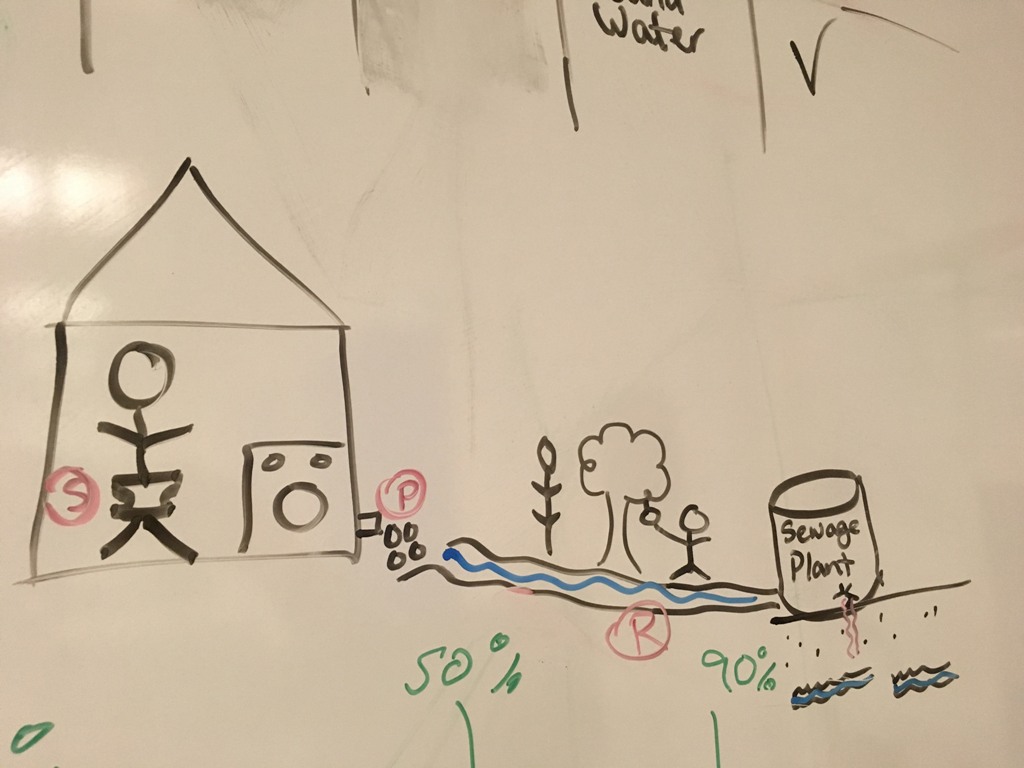
My attempt at a Source-Pathway-Receptor (S-P-R) Link diagram
Honestly, I can’t think of a better way to learn this material. From the overall study structure at Cranfield, to the day to day coursework – it’s perfect for me.
Categories & Tags:
Leave a comment on this post:
You might also like…

Using AI tools for your literature review
There are a proliferation of AI tools that can help you organise your life, work and study. This post focuses on academic or scholarly tools that have been developed to enhance the literature searching process, whether for independent research, an assignment or thesis. Bear in mind that these predominantly relate to finding journal/research papers, and not technical, business or trade sources such as standards, market research, industry reports or financial data. So ...

Finding successful past Cranfield theses
It’s always a good idea to look at examples of theses before you start work on your own. You may find them valuable for reading previous research, and for looking at structure, style and methodology. ...

On‑campus or off‑campus? How Cranfield students found their home away from home
Finding the right place to live is one of the biggest decisions you’ll make as you begin your student journey. Whether you’re looking for the convenience and community of living on-campus or the independence ...

Avoiding common referencing errors
As librarians, we get to see the full spectrum of reference lists in student work —from exemplary to … well, let’s just say, works still very much in progress! We are experts in spotting mistakes ...

Using your Mendeley library after you have left Cranfield
So you have spent the whole year (or more) lovingly collecting references around the topics that matter to you and now you have a large, personalised library in Mendeley Reference Manager containing all that information. ...

Referencing the use of generative AI in your work
We recognise that Artificial Intelligence (AI) has, and will increasingly, become a part of our everyday lives and that we need to adapt to it. Hopefully you will have already seen the guidance for staff ...