


Why Performance Reporting is NOT Performance Management!
03/04/2017

“Mirror, mirror on the wall whose presentation is the fairest of them all?”
“GDP last quarter is higher than the previous quarter, and the same quarter last year”, says Kamal Ahmed of the BBC News. So far his reporting is correct. “Therefore it’s improving!”, and that’s where his performance management is wrong! The accurate thing that he can say looking at GDP data like this is “Therefore it’s different!”
There’s a massive chasm between reporting what has happened in the past and claiming it tells us about performance management – i.e. about what is likely to happen going forward. Let’s look at 3 aspects of this little conundrum:
- How can we better understand what has happened in the past (in order to take more appropriate action going forward)
- What can we say about what is likely to happen going forward (with/without any intervention)
- What are the fundamental differences between Performance Reporting and Performance Management
Let’s go back to Kamel Ahmed, and to keep things less controversial for this piece, we’ll look at GDP for the UK (figures from the World Bank – and let’s not get into which sources of figures best suit what position we want to take, or who can present the fairest of them all) on an annual basis up to and including 2011. The first thing you’ll notice is (refer back to previous posts on this matter) we are not showing % increases. The misleading reporting we hear and see around the %GDP increase this period (month, quarter, year) is x% better than last period – as if there is some God-given right that %GDP should always be increasing (we are living in a finite world!). If this was indeed the case, then we would be see raw GDP increase exponentially! That looks something like this:
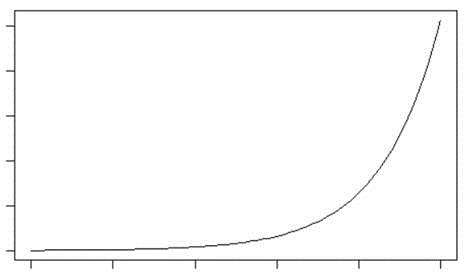
This would mean infinite raw GDP sometime soon. “Unrealistic!” you might say!
So what does raw GDP actually look like:
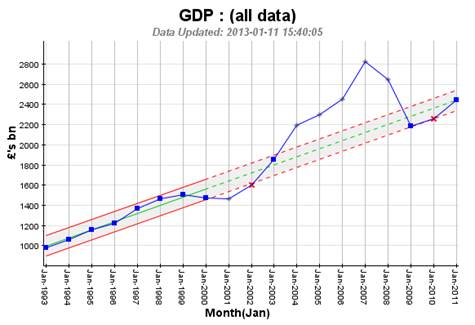
Interesting! I only have the figures back to 1993, but you have to start somewhere! We are showing the annual figures within trended (Extended-SPC, see previous posts) guidelines – and it is the pattern and trend we should look at as much as the actual individual annual results. We can see up until the credit boom in the early 2000s GDP was trending upwards at about £100bn per year (not unhealthy!). Then GDP dipped around the bursting of the “dotcom bubble”, around 2000 – 2002, and then went nuts with the credit fuelled economy. Then there was a correction (some say disaster, but, as I say, we are living in a finite world!) around 2007/2008. And guess what, the following 3 years where everyone thought we were in “plateau-land” (percentages!) GDP returned to the previous upward trend established in the earlier part of the chart.
Is this a better way of looking at Performance in order to understand it? I’ll leave that with the reader …. and next time we’ll have a look at house prices in the same way, and see if we can see a pattern. After that? We’ll attempt to answer the final two questions posed above…
David Anker
Categories & Tags:
Leave a comment on this post:
You might also like…

Using AI tools for your literature review
There are a proliferation of AI tools that can help you organise your life, work and study. This post focuses on academic or scholarly tools that have been developed to enhance the literature searching process, whether for independent research, an assignment or thesis. Bear in mind that these predominantly relate to finding journal/research papers, and not technical, business or trade sources such as standards, market research, industry reports or financial data. So ...

Finding successful past Cranfield theses
It’s always a good idea to look at examples of theses before you start work on your own. You may find them valuable for reading previous research, and for looking at structure, style and methodology. ...

On‑campus or off‑campus? How Cranfield students found their home away from home
Finding the right place to live is one of the biggest decisions you’ll make as you begin your student journey. Whether you’re looking for the convenience and community of living on-campus or the independence ...

Avoiding common referencing errors
As librarians, we get to see the full spectrum of reference lists in student work —from exemplary to … well, let’s just say, works still very much in progress! We are experts in spotting mistakes ...

Using your Mendeley library after you have left Cranfield
So you have spent the whole year (or more) lovingly collecting references around the topics that matter to you and now you have a large, personalised library in Mendeley Reference Manager containing all that information. ...

Referencing the use of generative AI in your work
We recognise that Artificial Intelligence (AI) has, and will increasingly, become a part of our everyday lives and that we need to adapt to it. Hopefully you will have already seen the guidance for staff ...