


Why Performance Reporting is NOT Performance Management! – Part 4
10/05/2017

This is the transcript of a radio conversation of a US naval ship with Canadian authorities off the coast of Newfoundland in October, 1995.
Americans: Please divert your course 15 degrees to the North to avoid a collision.
Canadians: Recommend you divert YOUR course 15 degrees to the South to avoid a collision.
Americans: This is the Captain of a US Navy ship. I say again, divert YOUR course.
Canadians: No. I say again, you divert YOUR course.
Americans: This is the aircraft carrier USS Lincoln, the second largest ship in the United States’ Atlantic fleet. We are accompanied by three destroyers, three cruisers and numerous support vessels. I demand that YOU change your course 15 degrees north, that’s one five degrees north, or countermeasures will be undertaken to ensure the safety of this ship.
Canadians: This is a lighthouse. Your call.
And how many times do we see this sort of thing happening in real business life where badly formed information is available to a senior decision-maker, his/her recommended action is potentially disastrous, we can all see it coming, yet because seniority, opinion and experience outrank evidence, we press on regardless?
Over the past 3 posts, we introduced the idea that Performance Reporting is not Performance Management and started to examine 3 aspects of this little conundrum:
- How can we better understand what has happened in the past (in order to take more appropriate action going forward)
- What can we say about what is likely to happen going forward (with/without any intervention)
- What are the fundamental differences between Performance Reporting and Performance Management
We’ve looked at the first 2 bullets and we’ve started exploring the final bullet in some detail – What are the fundamental differences between Performance Reporting and Performance Management.
We considered a Business Process (no matter whether private or public sector) and how the classic approach to Performance Reporting and Analysis achieves little in actually improving the Business Process.
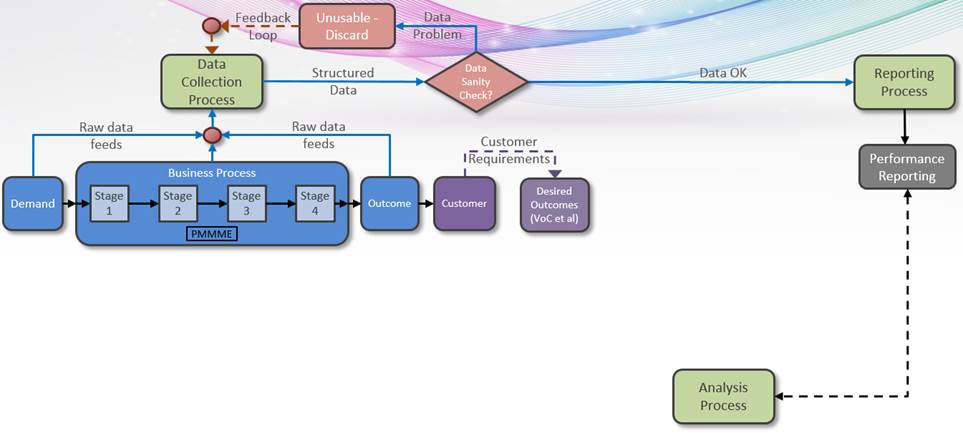
So now we’ll make some changes to this picture that will transform the effectiveness and productivity of those involved in Performance Management.
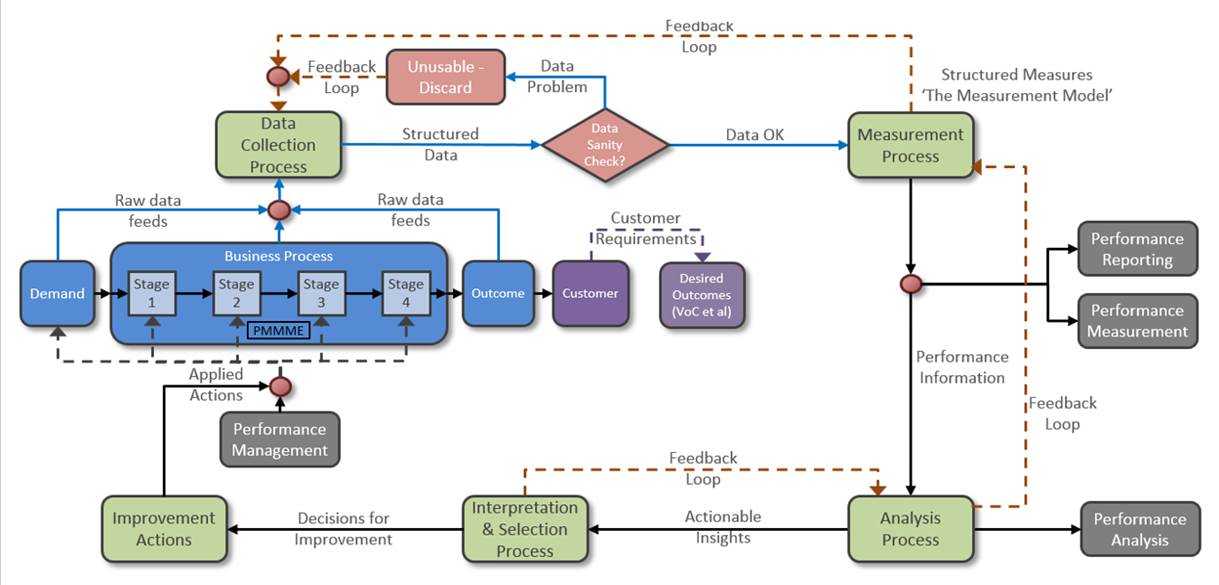
The first point to notice is that a Measurement Process (top right) has been introduced. It supports as a critical bi-product a Measurement Model containing Structured Measures (and subject of a previous blog) only up to 10 critical Measures (End-to-End and Stage by Stage). This first of all stops all the bun-fights or “workshops” that many managers have where everyone and their dog get to pitch in with what measures they think are critical, or the regulator tells us we “have to have”. There may be additional measures required for good reason, but for improvement purposes, no more than 10 prescribed measures! Note also the feedback loop (top) from the Measurement Process to the Data Collection Process. This is crucial since if there is a problem constructing the critical Improvement Measures because of missing / poor quality data, then the Data Collection Process needs to be improved.
Note also that Performance Measurement and Performance Reporting come from the same source – the Measurement Model. Furthermore, the Measurement Model feeds the Analysis Process (bottom right) which supports Performance Analysis. There are many occasions where we have seen “specialists” (e.g. 6-sigma crews) asked to analyse a problem and subsequently take their own data extract separately from the Business Process with none of the checks and balances in the structure above. The resultant observations / recommendations these people provide is either argued with (because management has a different set of data through the Reporting route) or management just goes ahead and implements the recommendations which were derived out of context (and then are surprised that the “improvements” don’t deliver – or worse, the improvement project is doomed to success!). Note again the feed-back loop between the Analysis Process and the Measurement Process. If, as we start to, e.g. drill down into reasons for deliveries being late or incidents requiring unusually long response times, and find in a Pareto analysis the largest driver is something like “Other”, “System”, “Miscellaneous” etc., then the Measurement Model must be modified to trap the appropriate filters available to penetrate such fog! This may, in turn, mean feeding-back into the Data Collection Process and require changes to the IT systems running the Business \Process so as to capture more useful data.
Coming out of the Analysis Process, are (hopefully) Actionable Insights, which will require Interpretation and Selection for onward feed-forward Decisions to Improve and the implementation of Improvement Actions. Note again the feed-back loop which is required if the Interpretation requires further analysis and information before an Improvement Decision can be selected.
And finally, the Outcome of the Business Process will be monitored against the Desired Outcome to confirm (or not as the case may be) in the Analysis Process whether it worked or not.
This is the first step towards Performance Management – there are two further steps that we’ll look at next time. But if your organisation is actually working anything like the latter of the two diagrams above, you’re in a good place.
So Americans or Canadians? Performance Reporting or Performance Management? Your call!
Categories & Tags:
Leave a comment on this post:
You might also like…

Using AI tools for your literature review
There are a proliferation of AI tools that can help you organise your life, work and study. This post focuses on academic or scholarly tools that have been developed to enhance the literature searching process, whether for independent research, an assignment or thesis. Bear in mind that these predominantly relate to finding journal/research papers, and not technical, business or trade sources such as standards, market research, industry reports or financial data. So ...

Finding successful past Cranfield theses
It’s always a good idea to look at examples of theses before you start work on your own. You may find them valuable for reading previous research, and for looking at structure, style and methodology. ...

On‑campus or off‑campus? How Cranfield students found their home away from home
Finding the right place to live is one of the biggest decisions you’ll make as you begin your student journey. Whether you’re looking for the convenience and community of living on-campus or the independence ...

Avoiding common referencing errors
As librarians, we get to see the full spectrum of reference lists in student work —from exemplary to … well, let’s just say, works still very much in progress! We are experts in spotting mistakes ...

Using your Mendeley library after you have left Cranfield
So you have spent the whole year (or more) lovingly collecting references around the topics that matter to you and now you have a large, personalised library in Mendeley Reference Manager containing all that information. ...

Referencing the use of generative AI in your work
We recognise that Artificial Intelligence (AI) has, and will increasingly, become a part of our everyday lives and that we need to adapt to it. Hopefully you will have already seen the guidance for staff ...