


Why Performance Reporting is NOT Performance Management! – Part 3
03/05/2017

We’ve enlisted the help of Jim Hacker from that well-loved series “Yes, Minister“, along with his trusty Principal Private Secretary Bernard Wooley to make a point for us this week:
Hacker: “Why can’t Ministers go anywhere without their briefs?”
Bernard: “It’s in case they get caught with their trousers down!”
And this is the problem with performance Reporting! Let’s look at a real example.
Rather than Police this week, we’ll look at a global pharmaceutical company delivering product to customers where they’ve committed to deliver to an agreed Service Level from order to delivery of 126 days at most.
Week on week reporting:
07/01/2013: 150 days: “Well, it was the first week back after New Year, what do you expect?”
14/01/2013: 106 days: “Well done!”
21/01/2013: 124 days: “Keep it up!”
28/01/2013: 117 days: “Your January bonus is secure”
11/02/2013: 131 days: “Not good enough, we’ll be caught with our trousers down and end up paying penalties if we don’t improve!”
18/02/2013: 114 days: “Great – back on track”
25/02/2013: 175 days: “What the *%!^?”
And so on…
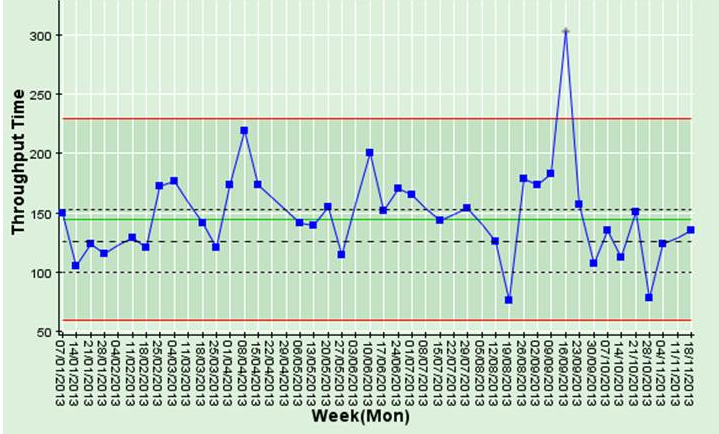
Now if they’d been a bit more savvy, and were doing proper Performance Management rather than Performance Reporting, they’d be using a chart like the one below, where they could see that the average (green line) over time is just below 150 days. So this is not about what happened in week 11/02/2013 nor in week 25/02/2013 – the whole delivery process is failing to perform according to contract (represented by the longer dashed black line – 126 days). So they need to work on improving the whole process, not on what happened any one week. Although, by the way, there was a spectacular failure in the week of 16/09/2013 when the orders took over 300 days! This tells us also about what will happen in 2014 – they will continue to deliver on average at just under 150 days, but could take as long as 230 days (upper red performance guideline) or as little as 70 days (lower red performance guideline) unless there is a significant change to the process.
Last time we introduced the idea that Performance Reporting is not Performance Management and started to examine 3 aspects of this little conundrum:
- How can we better understand what has happened in the past (in order to take more appropriate action going forward)
- What can we say about what is likely to happen going forward (with/without any intervention)
- What are the fundamental differences between Performance Reporting and Performance Management
We’ve looked at the first 2 bullets; we’ll now start to address the third – What are the fundamental differences between Performance Reporting and Performance Management.
We’ll start with any business process – it could be Police incident response, Ambulance response, Delivery of pharmaceuticals, Maintaining the rail network…
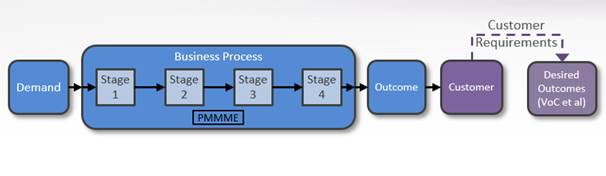
There is some level of Demand coming in, the Demand is processed through a number (in this case 4) transformative (or value-add) stages consuming resources (PMMME = People, Material, Methods, Machines, Environment) and delivers an Outcome for the Customer which the Customer will evaluate according to Requirements. Typical IT solutions that implement these processes offer some form of reporting and so-called analytic capability by extracting usually a limited set of data from the IT system and producing reports. Sometimes IT will provide an “Analytics Tool”.
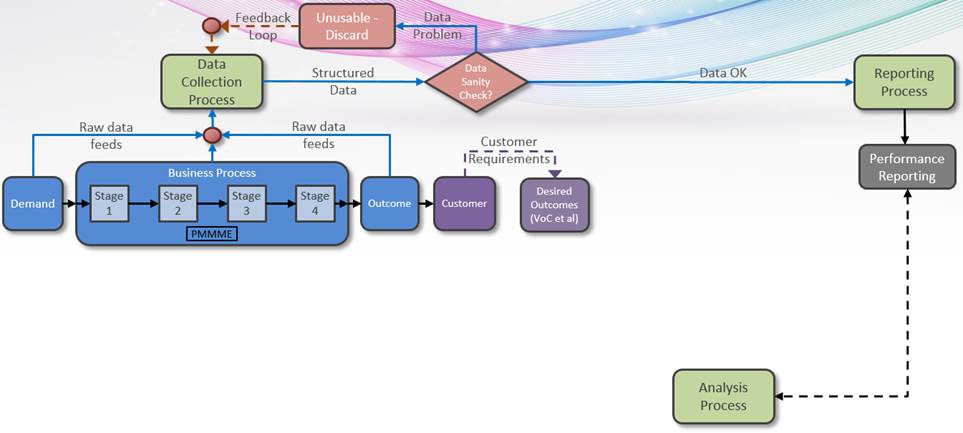
The problem is many-fold, in the “Management 1.0” approach. For example, there is no feed-forward into managing or improving the Business Process. Usually there is lots of animation and shouting/bullying/rewarding/gaming etc. Furthermore, the Data Collection Process (top left) isn’t seen as a process, it’s usually seen as “what can IT provide?”. Many times, the data is just a jumble from the activities in the Business Process, and it’s up to the so-called “Analysts” to sort it out. Hence, we see largely in every organisation Analysts are actually data collectors / manipulators / presenters. They do very little value-add Analysis and Recommendation on what to act on for improvement. If there was a Data Collection Process constituted correctly, it should provide structured data, and a Sanity Check would ensure it was broadly useful (and feed-back as appropriate). A Sanity Check does NOT mean “all data must be cleansed”. Just enough (usually more than 50%) needs to be good enough (again invoking Black Box Thinking – Matthew Syed).
So this is the usual Performance Reporting – disjoint from the Business Process, no feed-back into the Data Collection process and no feed-forward to Business Process Improvement, with Analysis spending most of its time in data manipulation. Sound familiar?
Next time, we’ll look at what might be regarded as something a bit more value-add…
Categories & Tags:
Leave a comment on this post:
You might also like…

Using AI tools for your literature review
There are a proliferation of AI tools that can help you organise your life, work and study. This post focuses on academic or scholarly tools that have been developed to enhance the literature searching process, whether for independent research, an assignment or thesis. Bear in mind that these predominantly relate to finding journal/research papers, and not technical, business or trade sources such as standards, market research, industry reports or financial data. So ...

Finding successful past Cranfield theses
It’s always a good idea to look at examples of theses before you start work on your own. You may find them valuable for reading previous research, and for looking at structure, style and methodology. ...

On‑campus or off‑campus? How Cranfield students found their home away from home
Finding the right place to live is one of the biggest decisions you’ll make as you begin your student journey. Whether you’re looking for the convenience and community of living on-campus or the independence ...

Avoiding common referencing errors
As librarians, we get to see the full spectrum of reference lists in student work —from exemplary to … well, let’s just say, works still very much in progress! We are experts in spotting mistakes ...

Using your Mendeley library after you have left Cranfield
So you have spent the whole year (or more) lovingly collecting references around the topics that matter to you and now you have a large, personalised library in Mendeley Reference Manager containing all that information. ...

Referencing the use of generative AI in your work
We recognise that Artificial Intelligence (AI) has, and will increasingly, become a part of our everyday lives and that we need to adapt to it. Hopefully you will have already seen the guidance for staff ...