The Future of Operational Performance Management – Part 4
10/03/2017

Einstein is quoted as saying “The definition of insanity: Doing the same thing over and over again and expecting a different result!”. I wonder if there is a converse quotation we can introduce, “Another definition of insanity: When there’s a perfectly good way of doing something, why keep re-inventing the wheel and expecting a better result?” We’re not suggesting we never look to improve on a technique, but we are suggesting we set a standard baseline – then at least we can judge whether we are indeed improving, rather than inventing more and more exotic ways of looking at a problem because software packages allow us to do so!
Over the past few weeks we’ve been comparing Financial Performance Management (over 500+ years) with Operational Performance Management (over 50+ years), and looking for the equivalent in Operational Performance Management of what is a perfectly good standard way of understanding Financial Performance.
We introduced 3 questions:
- Would it contain just a standard set of measures?
- Would it be presented in a standard way?
- Would it be presented on a monthly basis?
The first of these questions has been answered in previous posts, where we introduced a standard set of, at most, 10 critical measures required for improving Operational Performance. This post will address the second question. And we’ll take just one of our 10 measures – Demand – and follow through with our proposition.
In Financial Performance Management, the equivalent might be, say, Total Revenue (and the top-line Revenue may be the sum of all Revenues from each , say, Region that the organisation operates in). Their standard way to evaluate performance is to compare the latest result with some previous result or plan/budget in tabular form. This may work for accountants, since i) the Regional Revenues must add up exactly to give Total Revenue – there is no room for variation, and ii) the past 500 years seems to have shown that comparing the latest Total Revenue against some previous result or against Plan/Budget also works for them. The key difference is that Financial Performance is an abstraction of what is actually going on. It is a model removed from the real world.
In Operational Performance Management, we now need a standard way of showing results, but we have to take the real world into account. It’s where the accountant’s pencil meets the operational coal-face! And that means handling variation! Just as the financiers in Venetian times must have looked at other “professions” such as architects, stone-masons, scientists and so on, to help mould their tools as they developed, we have a perfectly sound and proven way of handling variation developed in engineering – it’s called Statistical Process Control (or SPC for short). And just as those financiers of olden times shaped the tools they borrowed from other professions, we need to extend and adapt SPC to work satisfactorily in a services (as opposed to a more controlled engineering environment).
Let’s look at Demand in, say, a Police environment. It could just as easily be ambulance, hospital, pharmaceutical supply-chain, infrastructure / asset management – it doesn’t matter.
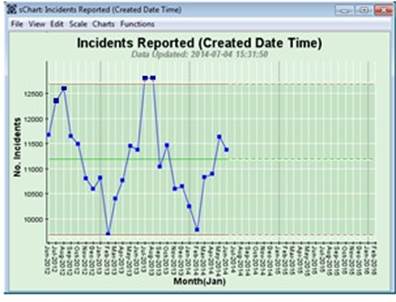
Below is an example of Incident Demand on one Police Force:

So, with variation like this, how can you say if things are getting better – there’s absolutely no point in looking at the latest result for June 2014 and comparing it with, say, May 2014 and declaring we’re improving because it’s lower! Does that type of comparison tell us what is likely to happen in July 2014 – well just look at the two previous Julys. Or you could compare June 2014 with June 2013 and declare it slightly better, therefore we’re improving? But what about May 2014 it’s higher than May 2013 – so we were worse then! And there are many organisations behaving just like this! This is a wonderful display of Einstein’s insanity!
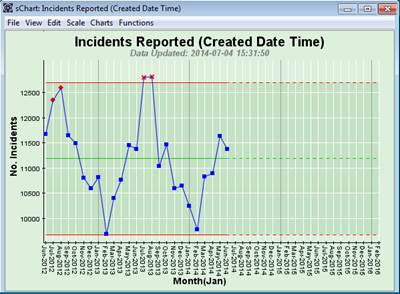
So let’s not keep doing the same thing, nor employ the unnecessarily exotic, but borrow SPC from engineering – initially without extending and adapting it to a services environment:

Hey Presto! We’ve added two red lines (in engineering speak upper and lower control limits, about 12,700 and 9,700 respectively), and a green line (about 11,200) which is the average over the length of time of the chart. What does this tell us? It says i) we have lots of variation (represented by the distance between the upper and lower red lines – so up to 12,700 – 9,200 = 3,000 per month), i.e. it is very unpredictable; and ii) it is definitely not improving (nor deteriorating). Your challenge now is to resource officers up to handle this Demand and make some improvements! Say, just say, 1 officer can handle on average 100 Incidents per month. So if we were to use the average, we would deploy 112 officers each month (a good accountant’s approach!). However, this would mean in Februarys, with around 9,700 Incidents, we’d have 15 officers furtively trying to look busy! And in June and July we’d be 15 short, and spending a lot of money on overtime, or just not meeting Demand! So this is not yet that helpful! The problem is seasonality! More s**t tends to happen in this Force in the summer rather than the winter.
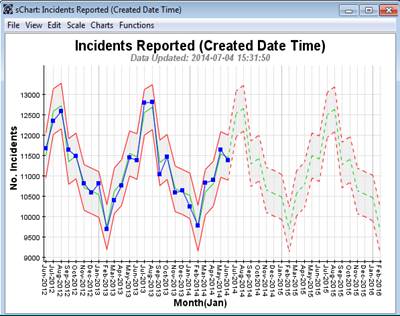
So now let’s extend and adapt this proven engineering approach to a services environment and take seasonality into account:

Now we see a seasonal pattern, with a much tighter variation (the Performance Corridor now tracks the seasonality and only shows the variation within that seasonality). You don’t get exactly the same number of Incidents each February or each June etc., but it is much more predictable than shown in the previous chart above. So this variation is taken into account by the seasonal Performance Corridor. So as this pattern repeats itself going forward (the dashed lines to the right of the chart) we can now see we have to adopt a seasonal profile to officer deployment. We need approximately 97+5 Officers handling Incidents in February, about 110+5 in April and around 127+5 in June and July. And to effect some improvement, we might use those 127 officers in a focused way to get this summer peak reduced.
So now, the Operational Performance Management go-to approach for understanding and visualising performance is extended-SPC, while the Financial Performance Management go-to method is tables of numbers for the latest period vs a previous period or plan/budget.
We’ll look at the frequency with which we look at Operational Performance vs Financial Performance next time…
Categories & Tags:
Leave a comment on this post:
You might also like…
Keren Tuv: My Cranfield experience studying Renewable Energy
Hello, my name is Keren, I am from London, UK, and I am studying Renewable Energy MSc. My journey to discovering Cranfield University began when I first decided to return to academia to pursue ...
3D Metal Manufacturing in space: A look into the future
David Rico Sierra, Research Fellow in Additive Manufacturing, was recently involved in an exciting project to manufacture parts using 3D printers in space. Here he reflects on his time working with Airbus in Toulouse… ...
A Legacy of Courage: From India to Britain, Three Generations Find Their Home
My story begins with my grandfather, who plucked up the courage to travel aboard at the age of 22 and start a new life in the UK. I don’t think he would have thought that ...
Cranfield to JLR: mastering mechatronics for a dream career
My name is Jerin Tom, and in 2023 I graduated from Cranfield with an MSc in Automotive Mechatronics. Originally from India, I've always been fascinated by the world of automobiles. Why Cranfield and the ...
Bringing the vision of advanced air mobility closer to reality
Experts at Cranfield University led by Professor Antonios Tsourdos, Head of the Autonomous and Cyber-Physical Systems Centre, are part of the Air Mobility Ecosystem Consortium (AMEC), which aims to demonstrate the commercial and operational ...
Using grey literature in your research: A short guide
As you research and write your thesis, you might come across, or be looking for, ‘grey literature’. This is quite simply material that is either unpublished, or published but not in a commercial form. Types ...


