


Systems-Thinking – Making it work for you – Part 3
01/02/2017

Jeremy Clarkson wrote in the Sunday Times about the shambolic state of executive decision-making: “…decision makers these days ….won’t actually make a decision until they’re confident they’ll get the credit if everything goes well, and someone else will get the blame if it doesn’t”. For those with BT shares – I wonder where the knowledge stopped about fiddling the books to the tune of £500million in Italy. I didn’t even know they had a Head of Europe – well they don’t since last week! Without evidence-based decision-making, this problem will go on and on … Systems Thinking has a critical part to play …
Over the last two weeks we have posted two blogs on making systems thinking work for you. Five key themes were introduced:
- Why it’s crucial to have a clear Purpose of your organisation and its fit in a joined-up System
- Why do we need to look at a System in terms of Processes
- What do we mean by Flow of work through the System
- How do we Measure the Performance of the System to Continuously Improve it
- How do we Manage the Performance of the System to Continuously Improve it
and the first three topics have been covered so far looking at, as an example, the Criminal Justice System (CJS).
In this third post on the topic, we’ll look at What to Measure, How to Measure, and, in the final post next week, What to Manage and How to Manage in order to Improve! Or
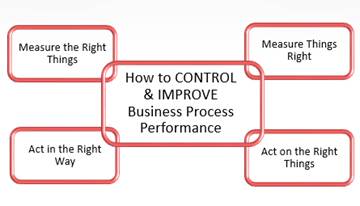
Measure the Right Things
For Process Improvement purposes, there is a Core set of attributes of the Process that must be measured. There may be lots of other attributes people feel they need to measure, but they will get in the way of process improvement. For example, simple ratios (there’s nothing simple about them!). There is a numerator and a denominator. The ratio can “change” in 3 ways each time it is measured (e.g. month by month) – it can go up, stay the same or go down. This tells you nothing about how the numerator or denominator has changed! Why? Because there are 9 different combinations of numerator and denominator that give the 3 results of the ratio! E.g. the numerator goes down, but the denominator goes down faster – the ratio goes up! It is left for the reader to work out the other 8 combinations…. And what levers do you pull to manage it?
In one global pharmaceutical organisation, they religiously tracked “Forecast Accuracy” – a measure that turned out to consist of 11 other measures so that nobody knew what levers to pull in order to make it go in the right direction (up!). In fact, we believe that the only person who knew that it was made up of these 11 other variables was the genius with the magic to respond to the management plea: “Don’t give me 11 things to look at, just give me one!” Hogwarts School of Performance Management if you ask me!
So what are these Core Measures? There are up to 10 and no more. 3 of them are – Demand, Throughput Time and Output. For the full set, please refer to the Cranfield Performance Delivery Programme. So executives need not look at 100’s of Measures if they want to make decisions about what levers to pull to improve things in their business.
Measure Things Right
For Process Improvement purposes, there is one proven method that beats all others in terms of effectiveness and efficiency – Statistical Process Control (SPC). Unfortunately, most people stop at the word Statist….! So what do people do instead, because there must be a simpler way to measure performance? How about latest result against target? There is extensive evidence that targets drive dysfunctional behaviour, so I’ll not comment about the validity of using targets here. Apart from this, comparing a single result against target tells you nothing about how well a System or Process is performing over time, nor, more importantly, what is likely to happen in future! Because stuff (Mike has reminded me to be polite here!) happens in the real world! The real world is not arithmetic – a Police Force might get 1,000 calls for assistance today, but tomorrow they may get 2,000, or 500, or 5,000…… So why try to measure the real world arithmetically? It’s simple you might say! But it’s wrong! Because the thing you need to measure goes up and down (i.e. it has Variation). To measure for improvement purposes, it’s mandatory to account for that Variation. And SPC is the most effective way to deal with it.
SPC came from understanding Manufacturing Systems some 50 or more years ago, and your car, washing-machine, computer, phone etc. will all have had SPC applied to their manufacturing processes – that’s why they have the quality they have! But in a Service System (like Police, Supply-chain, Asset/Infrastructure Management and so on), applying SPC Manufacturing Style will be “unhelpful”. It would be like learning to dance by watching Ed Balls go Gangnam Style!
Extended-SPC must be applied to be effective in a Service based System – for it has to handle things such as seasonality (summer vs winter), weekly cyclicity (Sundays tend to be quieter than Mondays), daily cyclicity (11:00 am is usually busier than 11:00 pm) etc., language used has to be modified since we need to engage with executives and managers not engineers, and so on.
An example from publicly available data on crime in our capital:
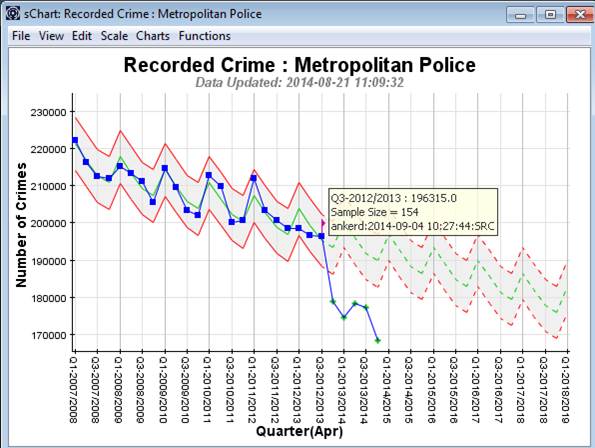
This Extended-SPC chart may look scary to some, but actually it’s quite simple to understand as I’ll hopefully explain in a few bullets. But first a few points about the features of these kinds of charts:
- The Measure, in this case Crime Volume, is the vertical axis, and Time measured by Quarter (where the Financial Year begins April, so Quarter 1 is April – June) is the horizontal axis
- The Crime Volume per Quarter is in blue, the Trended Seasonal Average is the green line and the upper and lower red lines are the Upper and Lower Performance Guidelines of the Performance Corridor (so future results will vary around the Average between the Upper and Lower Guidelines)
So what does this chart tell us:
- The Crime Volumes have been trending down (around 220,000 per quarter in Q1 2007/2008 and around 200,000 per quarter in Q1 2012/2013)
- Crime Volumes are seasonal, i.e. there tends to be more crime around Q1 and Q2 (late Winter/Spring) each year compared to Q3 and Q4 (Summer/Autumn) each year
- The corridor between the red lines shows that it would not be unusual for results to come in about 10,000 crimes either side of the Trended Seasonal Average
- The dashed lines to the right of the chart show what could be expected going forward, except
- The first green (down is good, so shown in green) + sign shows that a major disruption to the System (either the Criminal Justice System or the Criminal System – see first post on this subject) took place Q3 2012/2013
- The continued green + signs show this change is now sustained, and could be as a result of the flagged intervention called SRC in Q3 2012/2013
There’s more, but we’ll stop here for now. Surely the above tells us much more about the System than the arithmetic approach of “Well, the latest result in Q4 2013/2014 is lower than Q3 2013/2014, so we’re better than last quarter!” With the chart above, we now have irrefutable evidence that the intervention in Q3 2012/2013 has made a sustained reduction. So for Jeremy (who has one home in London) whoever ordered that intervention can now take the credit!
Categories & Tags:
Leave a comment on this post:
You might also like…

Using AI tools for your literature review
There are a proliferation of AI tools that can help you organise your life, work and study. This post focuses on academic or scholarly tools that have been developed to enhance the literature searching process, whether for independent research, an assignment or thesis. Bear in mind that these predominantly relate to finding journal/research papers, and not technical, business or trade sources such as standards, market research, industry reports or financial data. So ...

Finding successful past Cranfield theses
It’s always a good idea to look at examples of theses before you start work on your own. You may find them valuable for reading previous research, and for looking at structure, style and methodology. ...

On‑campus or off‑campus? How Cranfield students found their home away from home
Finding the right place to live is one of the biggest decisions you’ll make as you begin your student journey. Whether you’re looking for the convenience and community of living on-campus or the independence ...

Avoiding common referencing errors
As librarians, we get to see the full spectrum of reference lists in student work —from exemplary to … well, let’s just say, works still very much in progress! We are experts in spotting mistakes ...

Using your Mendeley library after you have left Cranfield
So you have spent the whole year (or more) lovingly collecting references around the topics that matter to you and now you have a large, personalised library in Mendeley Reference Manager containing all that information. ...

Referencing the use of generative AI in your work
We recognise that Artificial Intelligence (AI) has, and will increasingly, become a part of our everyday lives and that we need to adapt to it. Hopefully you will have already seen the guidance for staff ...