


Performance Reporting Measures vs Performance Management Measures
29/11/2019

You may have read my blog from last week about A&E Wait Times. We indicated that the way these kinds of figures are reported, out of context, is hopeless in actually understanding what is going on.
But the problem doesn’t stop there. There is a fundamental problem with performance reporting, and the measures you see being utilised there, versus performance management and the measures being utilised here!
Let me explain.
Performance management requires you to understand the behaviour of business processes and make interventions to improve them. This implies that you use a small set of specific measures that we’ve blogged about before – see previous bloghttps://blogs.cranfield.ac.uk/leadership-management/cbp/the-future-of-operational-performance-management-part-3
For example, these performance management measures would include number of items coming into a process, number leaving a process, throughput time and so on.
Performance reporting is littered with measures that may appear to carry meaning for some people, but in our observations, have been misleading and impenetrable to many. And certainly don’t help understanding nor how to improve!
Here are some examples of reporting measures:
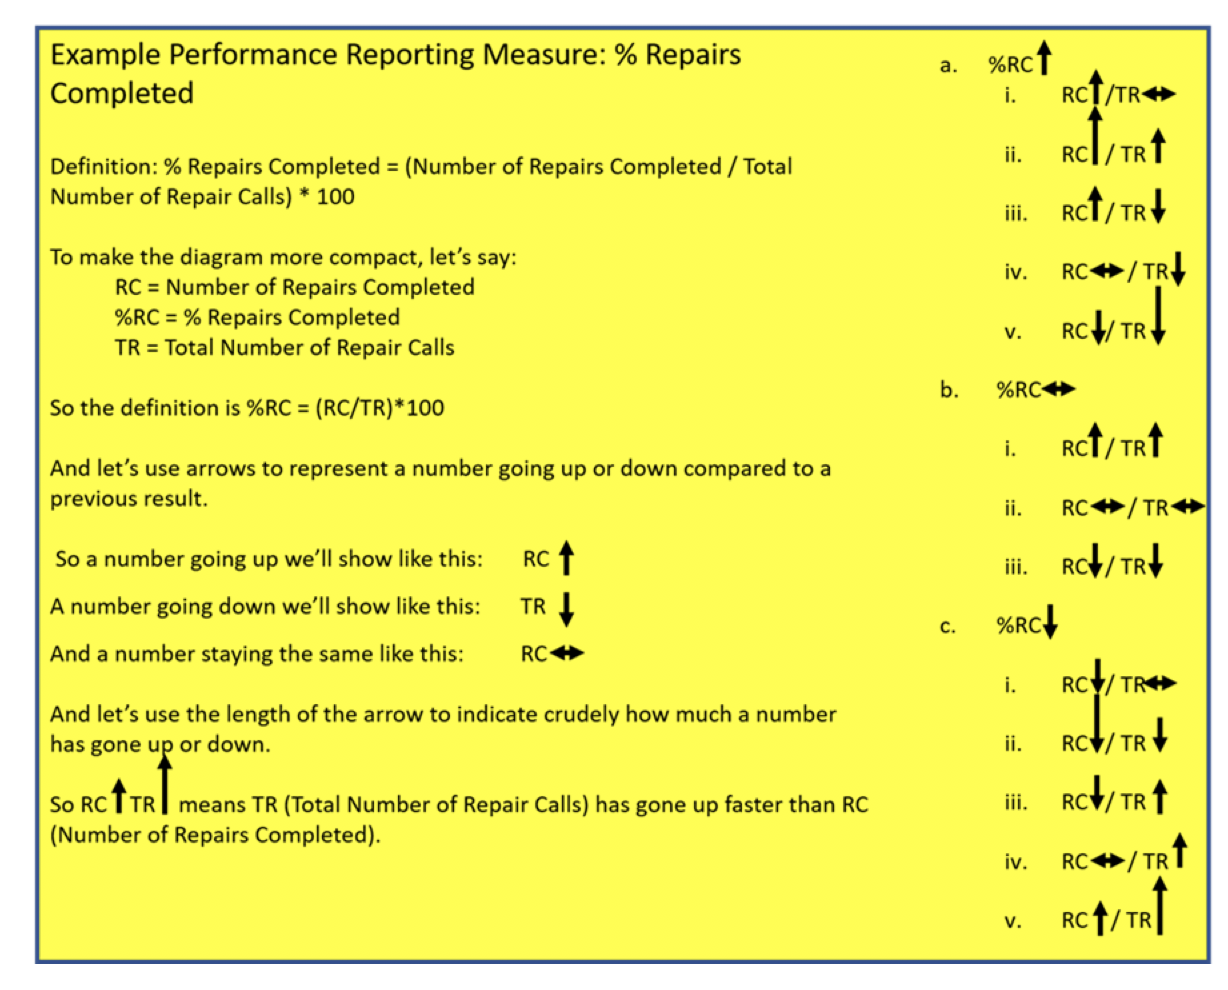
- % items completed: % implies a ratio – with a numerator and denominator. E.g. % Repairs Completed defined by (Number of Repairs Completed / Total Number of Repair Calls) * 100
- % completed within some timeframe: E.g. From last week’s A&E Figures, we saw % A&E attendants seen in 4 hours or under.
- Complicated Measure Combinations: E.g. % Forecast Accuracy in Supply-chain
- Applying sophisticated statistical treatment to raw performance measures that only stats specialists can read: E.g. Exponentially weighted moving averages
- Statistical representation of a population of people or things: E.g. Electric Car Use by Country
In today’s blog, we’ll look at why %’s are a problem (the argument is exactly the same for ratios) in trying to understand what is going on?
- % Repairs Completed: Let’s assume more is good and less is bad. Here’s how complicated we have made it to understand what is going on (see yellow box):
- % Repairs Completed has gone up (since it was last reported on). There are five different combinations of Number of Repairs Completed vs Total Number of Repair Calls:
i. Number of Repairs Completed has increased; Total Number of Repair Calls stays the same
ii. Number of Repairs Completed has increased; Total Number of Repair Calls increases, but at a slower rate
iii. Number of Repairs Completed has increased; Total Number of Repair Calls has decreased
iv. Number of Repairs Completed stays the same; Total Number of Repair Calls has decreased
v. Number of Repairs Completed has decreased; Total Number of Repair Calls decreases, but at a faster rate
- % Repairs Completed remains the same (since it was last reported on). There are three combinations of Number of Repairs Completed vs Total Number of Repair Calls:
i. Number of Repairs Completed has increased; Total Number of Repair Calls also increases at the same rate
ii. Number of Repairs Competed stays the same; Total Number of Repair Calls also stays the same
iii. Number of Repairs Completed has decreased; Total Number of Repair Calls also decreases at the same rate
- % Repairs Completed has gone down (since it was last reported on). There are five different combinations of Number of Repairs Completed vs Total Number of Repair Calls:
i. Number of Repairs Completed has decreased; Total Number of Repair Calls stays the same
ii. Number of Repairs Completed has decreased; Total Number of Repair Calls decreases, but at a slower rate
iii. Number of Repairs Completed has decreased; Total Number of Repair Calls has increased
iv. Number of Repairs Completed stays the same; Total Number of Repair Calls has increased
v. Number of Repairs Completed has increased; Total Number of Repair Calls increases, but at a faster rate
So, when we are performance managing, each of our two performance management measures can move one of 3 ways – go up, stay the same or go down. Simples!

But, when we are performance reporting, our one % reporting measure can move through any one of the 13 different combinations above! And I think Dilbert would have something to say about that!
And where %’s do come into their own is when drilling down using tools such as Pareto Charts to find root-causes of signals or drivers of patterns – more on this in our future blogs.
Why is the second example above – A&E attendances seen within 4 hours – a problem in trying to understand what is going on? For that you’ll need to read our next blog…
Categories & Tags:
Leave a comment on this post:
You might also like…

Using AI tools for your literature review
There are a proliferation of AI tools that can help you organise your life, work and study. This post focuses on academic or scholarly tools that have been developed to enhance the literature searching process, whether for independent research, an assignment or thesis. Bear in mind that these predominantly relate to finding journal/research papers, and not technical, business or trade sources such as standards, market research, industry reports or financial data. So ...

Finding successful past Cranfield theses
It’s always a good idea to look at examples of theses before you start work on your own. You may find them valuable for reading previous research, and for looking at structure, style and methodology. ...

On‑campus or off‑campus? How Cranfield students found their home away from home
Finding the right place to live is one of the biggest decisions you’ll make as you begin your student journey. Whether you’re looking for the convenience and community of living on-campus or the independence ...

Avoiding common referencing errors
As librarians, we get to see the full spectrum of reference lists in student work —from exemplary to … well, let’s just say, works still very much in progress! We are experts in spotting mistakes ...

Using your Mendeley library after you have left Cranfield
So you have spent the whole year (or more) lovingly collecting references around the topics that matter to you and now you have a large, personalised library in Mendeley Reference Manager containing all that information. ...

Referencing the use of generative AI in your work
We recognise that Artificial Intelligence (AI) has, and will increasingly, become a part of our everyday lives and that we need to adapt to it. Hopefully you will have already seen the guidance for staff ...