


Data Visualisation, Fantastic Beasts and Where to Find Them
28/11/2018

Data Visualisation, Fantastic Beasts and Where to Find Them
Wikipedia: Data visualisation is viewed by many disciplines as a modern equivalent of visual communication. It involves the creation and study of the visualrepresentation of data. According to Friedman (2008) the “main goal of data visualisation is to communicate information clearly and effectively through graphical means”.
CGI in films today pushes data visualisation to its limits, and many graphical presentation tools today allow even the most unskilled to develop “killer” presentations. But Friedman goes on to say “….. yet designers often fail to achieve a balance between form and function, creating gorgeous data visualisations which fail to serve their main purpose — to communicate information”. So in business, we’re not here to entertain (although there are exceptions!), but to use information to make decisions.
Wiki goes on to describe Visual Control: Visual control is a business management technique employed in many places where information is communicated by using visual signals instead of texts or other written instructions ….. Visual control methods aim to increase the efficiency and effectiveness of a process by making the steps in that process more visible …. Another aspect of visual control is that everyone is given the same visual cues and so are likely to have the same vantage point … A visual control system must have an action component associated with it … therefore, visual controls must also have a component where immediate feedback is provided to workers.
What does a Visual Control System look like?
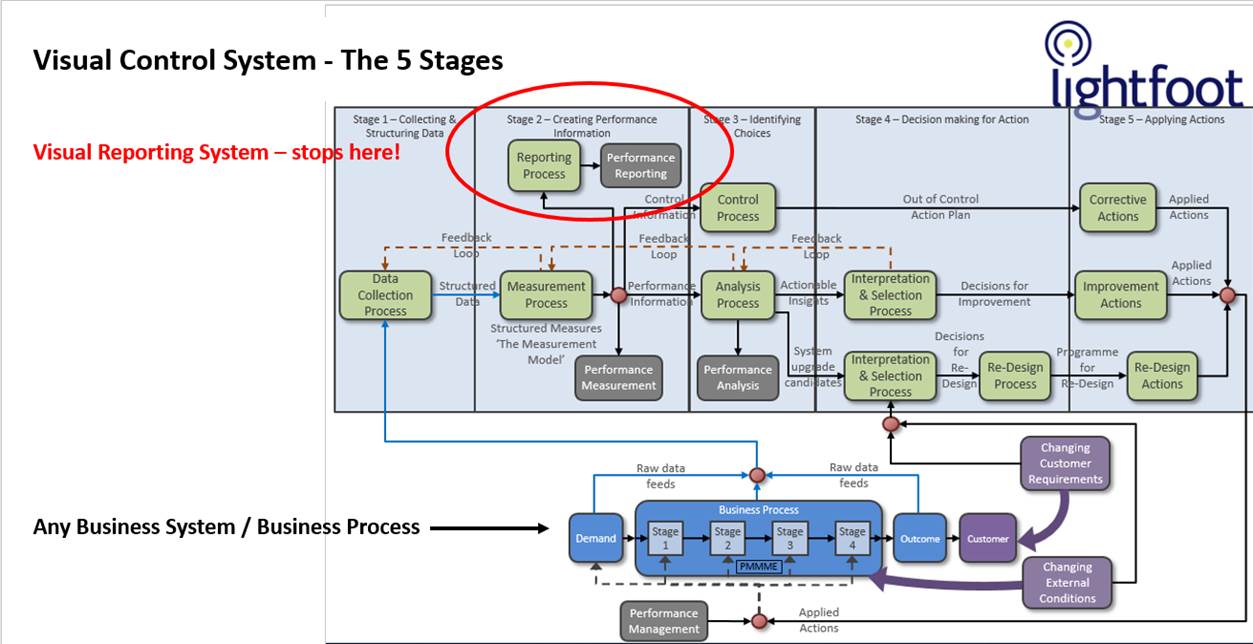
A Visual Control System – some prefer the term “Gantry View” or “Cockpit View” – comprises 5 key Stages, namely: 1. Data Collection and Structuring of Data; 2. Creating and Visualising Performance Information; 3. Identifying Choices (of Action); 4. Decision-making (for Action); 5. Applying Action. And Performance Management is where the “rubber meets the road” – so to speak. It’s actually applying the agreed actions to the business process. Where is Feedback on the success or otherwise of the Action taken in all this? Well that comes back in the form of data from whatever the business process is that you are expecting to improve. Hence, we have a closed-loop (not the Matthew Syed definition) – a Visual Control System.
The problem with most organisations is that they stop at delivering a Visual Reporting System, with no clear linkages to managing performance of the system or processes. But creative Visual Reporting – “generating gorgeous data visualisations” – can consume many resources, can be highly entertaining and can generate much activity, rather like Fantastic Beasts – but is that really the main purpose?
Categories & Tags:
Leave a comment on this post:
You might also like…

Using AI tools for your literature review
There are a proliferation of AI tools that can help you organise your life, work and study. This post focuses on academic or scholarly tools that have been developed to enhance the literature searching process, whether for independent research, an assignment or thesis. Bear in mind that these predominantly relate to finding journal/research papers, and not technical, business or trade sources such as standards, market research, industry reports or financial data. So ...

Finding successful past Cranfield theses
It’s always a good idea to look at examples of theses before you start work on your own. You may find them valuable for reading previous research, and for looking at structure, style and methodology. ...

On‑campus or off‑campus? How Cranfield students found their home away from home
Finding the right place to live is one of the biggest decisions you’ll make as you begin your student journey. Whether you’re looking for the convenience and community of living on-campus or the independence ...

Avoiding common referencing errors
As librarians, we get to see the full spectrum of reference lists in student work —from exemplary to … well, let’s just say, works still very much in progress! We are experts in spotting mistakes ...

Using your Mendeley library after you have left Cranfield
So you have spent the whole year (or more) lovingly collecting references around the topics that matter to you and now you have a large, personalised library in Mendeley Reference Manager containing all that information. ...

Referencing the use of generative AI in your work
We recognise that Artificial Intelligence (AI) has, and will increasingly, become a part of our everyday lives and that we need to adapt to it. Hopefully you will have already seen the guidance for staff ...
Thank you David. I do enjoy these, thank you for sending them.
Chris