


Mapping what’s beneath our feet on #WorldSoilDay
05/12/2017

Photos: Jack making soil observations using a soil auger; a map of strawberry growing areas in Hampshire by Dr Frances Kay 1939; National Soil Archive at Cranfield University; map of electrical conductivity revealing differences in soil types
Soil is responsible for supporting 95% of our food production. It also cleans water and regulates flooding, provides a habitat for below and above ground animals and plants, stores carbon and regulates the climate, and is part of our cultural heritage. Soil is many things to many people and is our most valuable resource on the planet. But I would say that, being a soil scientist!
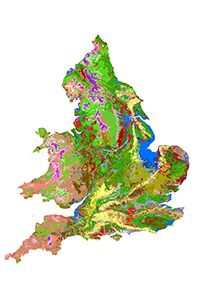 Isn’t soil just that brown, dirty, muddy stuff? Not all soil is the same. There are more than 700 different soil types in England and Wales (see photo left, © Cranfield University http://www.landis.org.uk/soilscapes/). This level of complexity means naturally the soils have different properties and also different capacity to perform all these things listed above. Some soils are good “all-rounders”, others are better at flood management than carbon storage, for example.
How do we know that there are different soils and where they change? This has been known locally by landowners and farmers since we have adopted agricultural practices. But regional and national scale assessments of soils were only started after WW1 in England. Many early maps focused on specific land uses such as strawberry growing areas. The map in the gallery above from the 1930s was produced and hand-coloured by Dr Frances Kay, the first female soil surveyor in England. She conducted the soil survey by bicycle and was known to be partial to smoking a pipe!
After WW2 the national soil survey for England and Wales was established at Rothamsted Experimental Station which spread to regional network of soil survey activities by the late 1960s. A 5 year mapping programme commenced in 1979 that produced a nationwide map of soil types and land use (for England and Wales) by the mid 1980s. Soon after, the soil survey moved to Cranfield University, where we remain custodians of the national soil datasets (LandIS), with a digital version of the map launched in 2001.
LandIS is national asset. The national map is the flagship but this is underpinned by many other observations, such as more than 300 county, regional and national soil publications and maps; a staggering 250,000 point observations of soil type; 8,000 soil profile descriptions and data from excavated soil pits; and more than 700 farm maps. The collection also includes physical samples that were taken during the systematic national surveys which are held in our national soil archive.
This data was originally gathered by hand by going out into the field to dig a hole, making observations and taking samples. It remains an important legacy as it underpins many of the techniques that we now use to conduct soil mapping at landscape and local scales. We can scan fields using electrical conductivity, which will reveal differences in soil type. We can apply artificial intelligence techniques (machine learning) to predict soil types and properties in the landscape, producing new maps and datasets. These techniques require reference or training data and this is where the legacy data is still really important.
Soil scientists are key to turning all this data into useful information by deriving a number of products, decision support tools and information systems from the soil survey data. These activities are crucial to identifying how soil functions and how we can manage soil resources sustainably for many more #WorldSoilDays to come.
Categories & Tags:
Leave a comment on this post:
You might also like…
Building more than research: Reflections from the ECRn Symposium 2026
There’s something quietly powerful about a room full of early career researchers. Not just the ideas, although there were plenty of those—but the conversations, the curiosity, and the sense that everyone is figuring things ...

Library services over Easter, 3-6 April
Kings Norton Library will remain open for study 24/7. You will need your University ID card to enter the building and can use the self-service machines to borrow and return items as usual. Barrington Library ...

How do I access the full-text of Harvard Business Review (HBR)?
This is a frequently asked question, and it's worth knowing how to access this key management journal. So, how do you access HBR in full-text? The short answer is via our eJournals finder. You can find ...

Engineering problem to solve? Let Knovel help you find a solution
Did you know that Knovel provides you with more than just eBooks? Knovel is a key database for many engineering, mechanical and materials courses here at Cranfield University, and contains content from an extensive range ...

What happens when female scholars meet influential leaders?
On the 5 March 2026, our British Council Women in STEM Scholars had the privilege of sitting down with two excellent role models of industry and academia: Professor Dame Karen Holford, ...

From MSc to CEO: Igniting a research revolution
For many, a master’s degree is achieving a big milestone. Kilyan Ocampo, Computational Fluid Dynamics alumni shares how studying at Cranfield helped launch his career in the energy sector. Today, Kilyan ...