


Performance Reporting Measures vs Performance Management Measures – Part 4
16/01/2020
Complicated Measure Combinations
You may have read my previous blogs comparing Performance Reporting Measures vs Performance Management Measures.
Performance reporting is littered with measures that may appear to carry meaning for some people, but in our observations, have been misleading and impenetrable to many. And certainly don’t help understanding nor how to improve!
Here are some examples of reporting measures that we introduced previously:
- % items completed: % implies a ratio – with a numerator and denominator. E.g. % Repairs Completed defined by (Number of Repairs Completed / Total Number of Repair Calls) * 100
- % completed within some timeframe: E.g. From a previous blog’s A&E Figures, we saw % A&E attendants seen in 4 hours or under.
- Complicated Measure Combinations: E.g. % Forecast Accuracy in Supply-chain
- Applying sophisticated statistical treatment to raw performance measures that only stats specialists can read: E.g. Exponentially weighted moving averages
- Statistical representation of a population of people or things: E.g. Electric Car Use by Country
This week we’ll look at Complicated Measure Combinations. Examples are % Forecast Accuracy in Supply Chain, % Problems Fixed Right First Time in telecommunications, Lost Customer Hours in a public transport system, and so on.
So we already know from our previous 3 blogs on this subject that % measures present problems, and measures that use % success within a constraint (usually time) / target inhibit understanding – so we’ll not revisit them here.
We’ll pick just one of the examples above that, quite frankly left us flabbergasted – % Forecast Accuracy. A division of a global pharmaceutical explained that their Sales & Operational Planning department used this so-called global supply-chain “Best Practice” measure to measure the performance of their sales and forecasting capabilities. And they had been working to a target of 70%, but it had recently been raised to 75%.
You’d think this measure simply measured the difference between sales and forecast for that month – yes?
No!
Not only did this measure suffer from the problems we have seen associated with % measures, when implemented in an IT system that had to deal with the messy real-world, this one measure became 13 other variables as well as the difference between sales and forecast!
And there were around 20 highly paid people around the world constructing and amalgamating various spreadsheets by country, region, brand etc., presenting the results (several weeks after the end of each month by the way), and then following up any actions / issues raised.
So, having said this, here’s the algorithm used to implement their version of forecast accuracy:
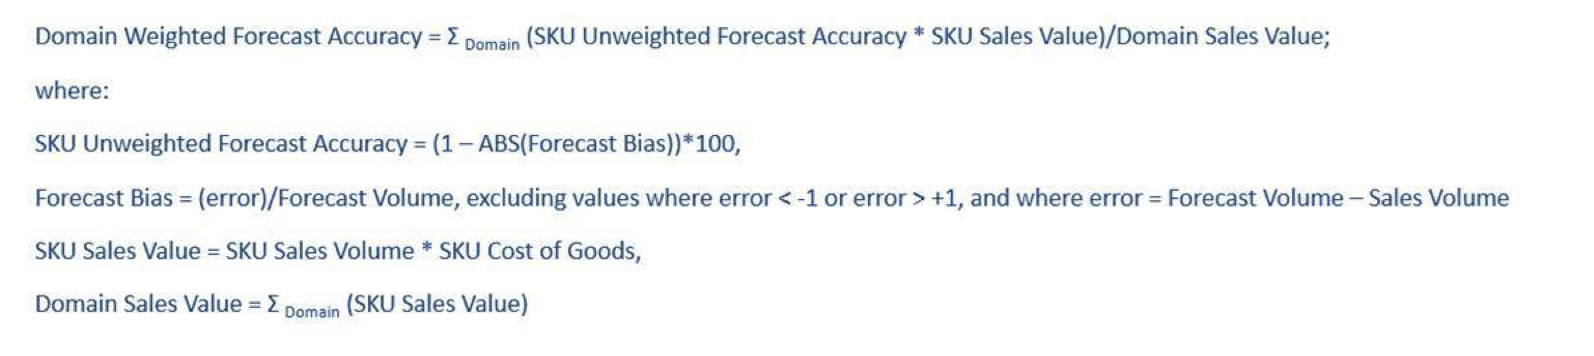
A few terms in the above need some explanation:
- Domain: Domain can be Therapy Area (Vaccines, Cancer, Heart etc.), or geographical Region / Country, or Brand / Sub-brand.
- SKU: Stock-keeping Unit – the smallest packed shippable quantity of a substance (100’s litres, 1,000’s of tablets etc.).
- Cost of Goods (CoGS): The internal costs associated with an SKU used to calculate SKU Sales Value.
So here’s a list that we found (I’m sure it’s not exhaustive) with the above formula (remember, we’re trying to track the difference between sales and forecast):
- SKUs not forecast: Not all SKUs are forecast. Some low-volume SKUs were not forecastable. Some Brand managers weren’t consistent in submitting a forecast. But if there were sales of these SKUs they were counted in the Domain Sales Value (see this problem further below).
- No CoGS: Not all SKUs had an associated CoGS, particularly if it was a new line, so Domain Sales Value would be incorrect.
- SKU Sales Volume: Not every SKU is sold every month, so, legitimately, SKU Sales Value could be zero, but it was not always easy to tell if this was due to no sales or no CoGS. And some Brand managers might be late in submitting Sales Volumes (and there was always a reason as to why it was actually different from the number in the computer system).
- Limiting error to be between -1 and +1: Their particular implementation of the algorithm could not handle sales that were either more than twice, or less than half forecast. In either of these cases, the relevant SKU was eliminated from the calculation. This was one of the biggest issues, since the whole aim was to find out those Brands and SKUs where sales were significantly different from forecast! And, these SKUs were still counted in the Domain Sales Value (see this problem further below).
- Returns: Every month, some SKUs were returned, and these had to feature in the calculation Domain Sales Value as negative sales. But, of course, they were never forecast and so were not counted in the calculation of SKU Unweighted Forecast Accuracy (see this problem further below)
- Domain Sales Value: Because this denominator in the final calculation contained SKUs that were not counted in the numerator, the final result was always depressed below what it should have been.
- SKU Unweighted Forecast Accuracy: Because this did not factor in Returns, yet the Domain Sales Value counted them as negative sales, there was some inflationary effect on the ultimate calculation, but this was far outweighed by the point immediately above.
- 75% Target: The whole S&OP Team had no idea that the calculation was such that there was never a realistic possibility of achieving much above 80% – 85%, yet they were all striving to exceed target (because bonuses were associated with his).
And finally, this particular Therapy Area had lead times of around 4 – 6 months, yet they were working on forecast accuracy based on forecasting only 2 months ahead. When asked why, they said it was because all the other Therapy Areas used 2 months!
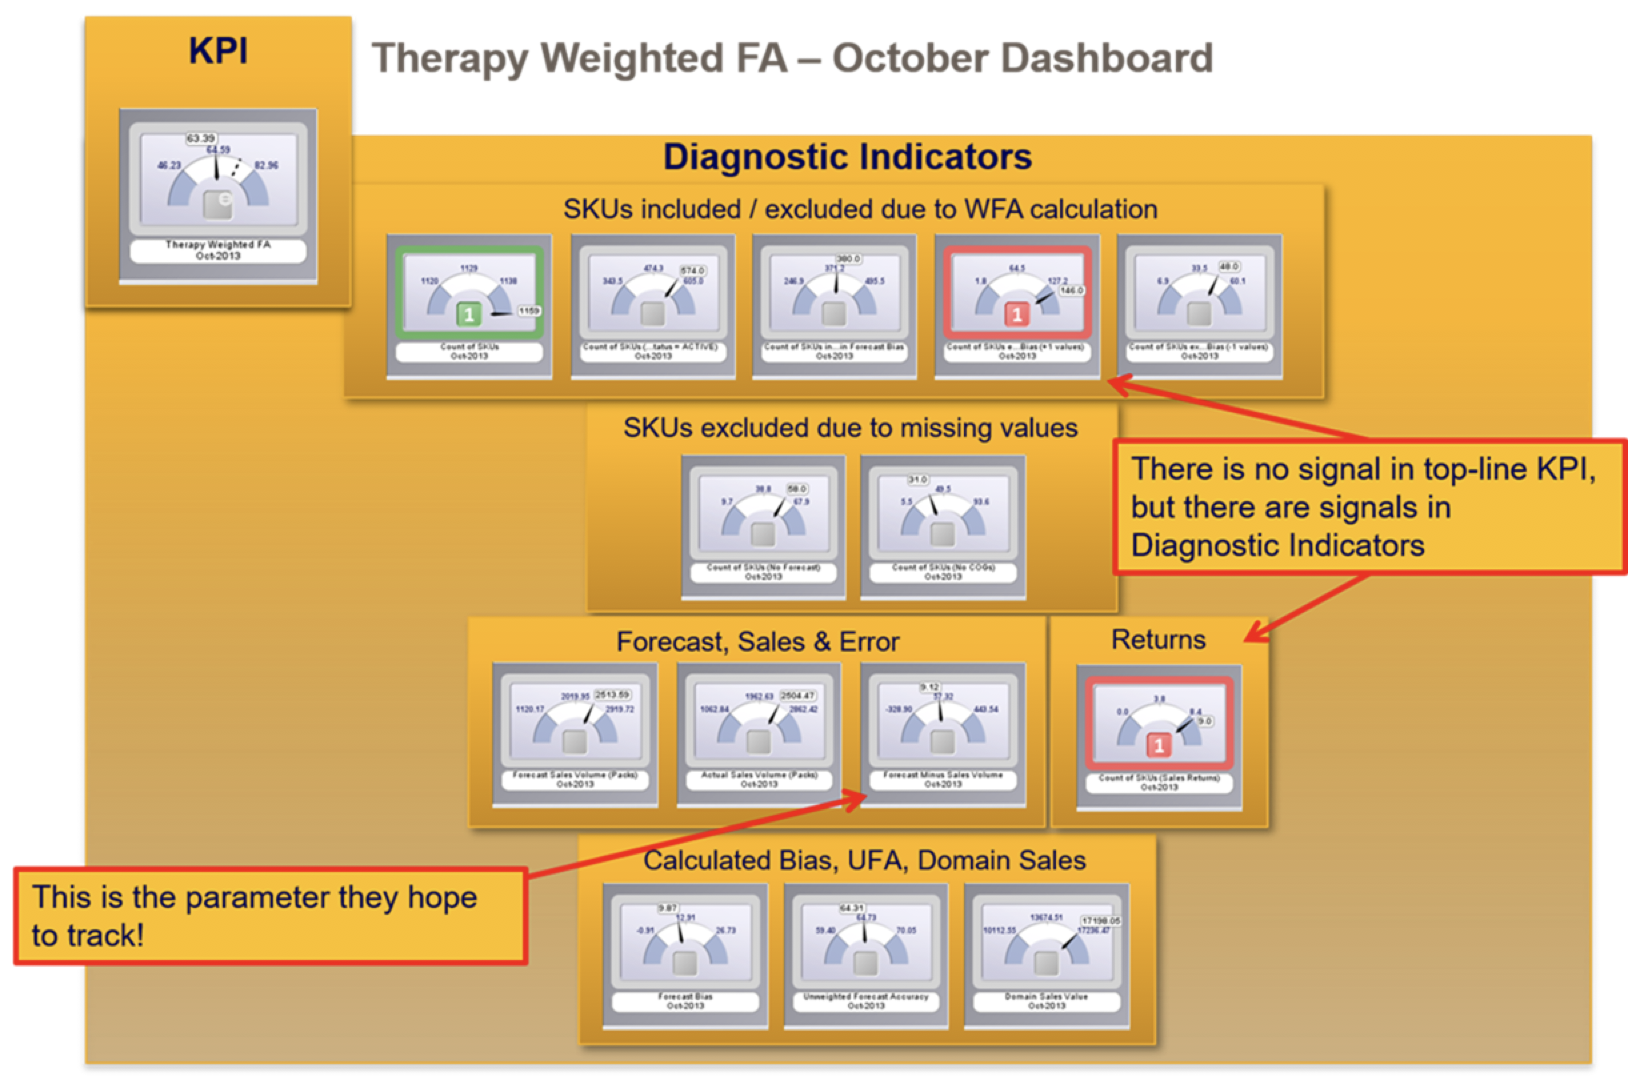
Our initial recommendation was, that if they insisted on tracking this unbelievably complex measure, then they needed to track all the underlying variables!
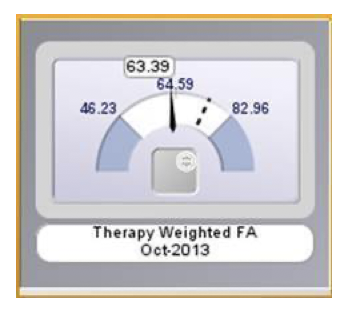
Hence, rather than looking at a single KPI:
That they need to track all underlying diagnostic measures as well:
We suggested to our sponsor that this whole activity for 20 people was a waste of time. They wrapped the department up a few months after our assignment, and allocated the staff to more productive efforts!
BTW: This is not the most complicated measure we’ve come across. In a public transport system for a major world capital, every Rail Period (4 weeks) they chase Lost Customer Hours (LCH). We have still to this day, not been able to find anyone who can provide a definition of this measure (“it’s spread across multiple complicated spreadsheets”). Good luck to them!
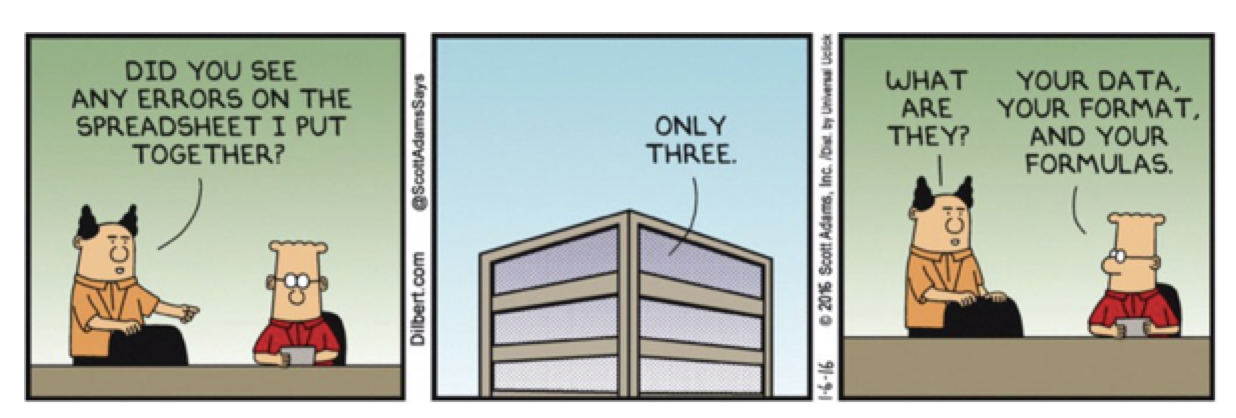
And Dilbert? Speechless for the first time I expect!
And next time in this series, we’ll look at sophisticated statistical treatment of measures.

Categories & Tags:
Leave a comment on this post:
You might also like…

Introducing Kings Norton Library
Welcome to all our new students! We are looking forward to meeting you soon. You will find Kings Norton Library in the centre of the Cranfield campus, and it is open 24/7 to all staff ...

Setting your research on the right course: Four questions every researcher should ask
Whether you are just beginning your doctoral journey or are already well into your research career, successful research rarely happens by accident. Like any successful mission, it depends on good planning, informed decisions, and getting ...

5 budgeting mistakes students make (and how to avoid them)
Good financial planning isn't about how much money you have. It's about the habits you build. We asked Dr Lakshmy Subramanian, Course Director for the Banking, Economics and Finance MSc, about the budgeting mistakes ...

Finding your reading materials
Use Library Search Library Search is the first place to start when you are trying to find academic sources for your work. This is the search box on the library website homepage. It allows you ...

Formula 1 was the dream and Cranfield was the conduit
I still remember the exact moment Formula 1 (F1) got its hooks into me. I was in my first year of an aerospace undergraduate engineering degree when I watched a video about the sport ...

Introducing Barrington Library
Welcome to all our new students! Barrington Library supports all the students and staff at Cranfield Defence and Security on the Shrivenham site. We are looking forward to meeting you all soon, in person or ...