


How do I reference… images, figures, and tables in the APA7 style?
28/08/2025

So you want to use an image or table in your assignment – but you don’t know how to cite it? Read on to find out how.
Any images, figures, graphs or tables that you copy from another author or creator need to be labelled with a title that describes what they show, along with an in-text citation indicating their source and, at the end of your work, a corresponding reference for that source. If the source has page numbers, these should be included, just like in a citation for a direct quotation.
You should see our blog post on Formatting and cross-referencing of tables and figures for more information on formatting and cross-referencing (how to refer to the figure/table in your text).
Citing images that you didn’t create yourself…..
This datagraphic comes from Euromonitor’s Passport database. Note that the citation is with the Figure number and title, below the image.
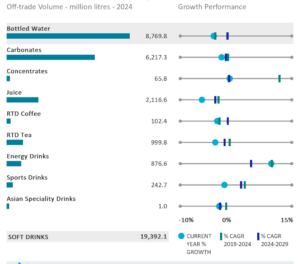
Figure 1: Sales of Soft Drinks by Category in Germany (Euromonitor, 2024)
Reference:
Remember too that you will need to include the appropriate reference in your reference list. For the example above, the reference would look like this:
Euromonitor (2024, January). Soft drinks in Germany. Passport. https://www.portal.euromonitor.com/
Citing tables that you didn’t create yourself….
This soft drinks data is also available in table form within the same Passport report. Note that the in-text citation is below, but the table number and title are positioned above.
Table 3: Sales of Soft Drinks by Category in Germany
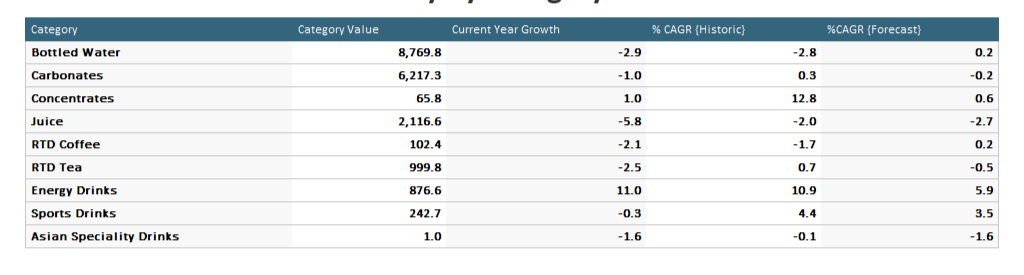
Source: Euromonitor, 2024.
Reference:
The full reference would again be:
Euromonitor (2024, January). Soft drinks in Germany. Passport. https://www.portal.euromonitor.com/
Citing an image or table that you have adapted from other sources….
If you have taken an image or data from another resource and developed or adapted it in some way, then you can indicate this in your in-text citation by adding the phrase ‘adapted from’ in the description of the figure/table. This would cover an image that you have redrawn and amended, adding a new column of data from another source to an existing data table or perhaps using data you have downloaded to create your own chart. See below for an example of an author doing this with an image.
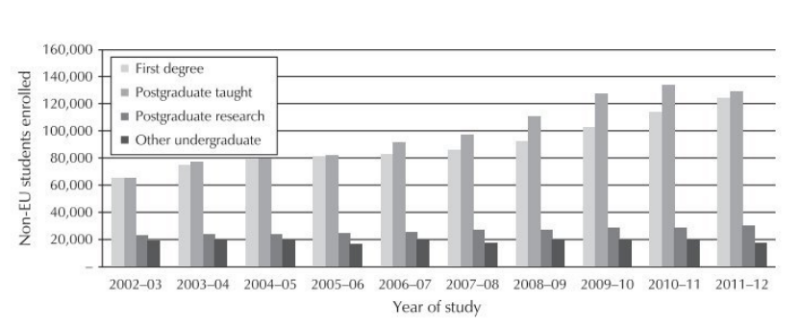
Figure 3.1 Trends in non-EU student enrolments by level of study, 2002-03 – 2011-12. Adapted from International Unit (2013a)
Reference:
International Unit. (2013a). International Higher Education in Facts and Figures, Autumn. Retrieved February 14, 2014, from http://www.international.ac.uk/media/2416084/intfacts2013.pdf
If you have used multiple sources to adapt your image or table, make sure to cite and reference them all. You can use our blog post How do I reference… a table of data from multiple sources? to help, if you are creating a table.
Citing an image or table that you have produced entirely yourself….
Either mention in your writing that you have produced the image entirely yourself or or state Source: author’s diagram where you would normally put your in-text citation.
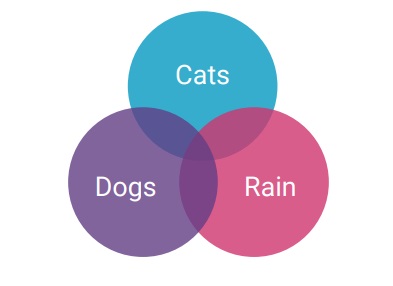
Figure 8: Incidences of weather terminology (Source: author’s diagram)
Don’t forget to refer to it in your text, but there’s no need to have anything in your reference list for this type of figure.
Please note: Cranfield supports two different referencing styles – APA7 (Author-date) and Numbered (NLM). Please make sure you use the style preferred by your supervisor or lecturer. The advice above relates only to the APA7 style. If you have any questions about referencing, please contact the Library.
Feature image from Pixabay. Available at https://cdn.pixabay.com/photo/2016/06/01/06/26/open-book-1428428_960_720.jpg

Categories & Tags:
Leave a comment on this post:
You might also like…
Keen to develop your study skills?
Alongside the technical skills and academic knowledge that you will gain on your course, as a Cranfield student you have the opportunity to develop a range of other skills that can enhance your learning experience. ...
The V-conomy: powering the sixth wave of global economic growth
The world could be on the verge of a major surge in economic growth and development, driven by the convergence of AI and clean energy technology. Waiting to ride the K-wave The Russian ...

Need help using the Python programming language?
We know some of our students are currently trying to learn Python, so we wanted to make you aware of some great LinkedIn Learning videos that can help. But don't you have to pay for ...

What does it really take to become a Chevening Scholar?
Say “Turkmenistan” to most people and you’ll get a blank look. That was true when I left Ashgabat for the UK to study an MSc in Logistics and Supply Chain Management at Cranfield University ...

Get a head start on referencing and plagiarism
We offer a module on Referencing And Avoiding Plagiarism which you can find on your Canvas dashboard. It explains the role and importance of citing references and how to incorporate the work of other authors ...
How Cranfield shaped my journey as an Aerospace Engineer
If I'm being specific about the moment it clicked, it was reading a paper called "On the Role and Challenges of Computational Fluid Dynamics (CFD) in the Aerospace Industry" by two Boeing engineers, P. ...
Comments are closed.