


Forecasting – Prediction is very difficult, especially if it’s about the future!
10/07/2017


Niels Bohr, the Nobel laureate in Physics and father of the atomic model, is quoted as saying, “Prediction is very difficult, especially if it’s about the future!” This quote serves as a warning of the importance of testing a forecasting model out-of-sample. It’s often easy to find a model that fits the past data well — perhaps too well! — but quite another matter to find a model that correctly identifies those features of the past data which will be replicated in the future.
So here’s the thing: in the private and public sector, we keep hearing senior executives talking about being more predictive — getting on the front-foot and being less reactive. Almost all of them fail to recognise that unless your business processes, their incoming demand and outgoing outcomes are not “In Control” (meaning in statistical control) then forecasting is worthless — a black art at best! Here’s an example of a process that is not In Control:
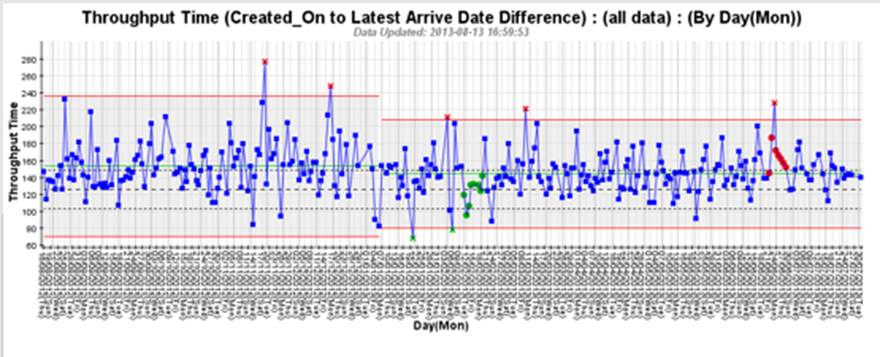
The above processes (there are 2 of them, with a change near the middle of the chart causing a “process break” between the first part of the process and the second part of the process) are not In Control. The chart has a large number of different types of signals, red x indicating unusually long delivery times, green x indicating unusually short delivery times, green • indicating sustained unusually short delivery times and red • indicating sustained unusually long delivery times. Using this data to forecast forwards will produce at best a range of between 80 and 200 (lower and upper red performance corridor guidelines on right part of chart), but because it’s not In Control, there will be occasions when these guidelines will be exceeded. This is because, as Niels Bohr says, the signals indicate that the process contains features that may or may not be replicated in the future.
Looking at a process that is In control:
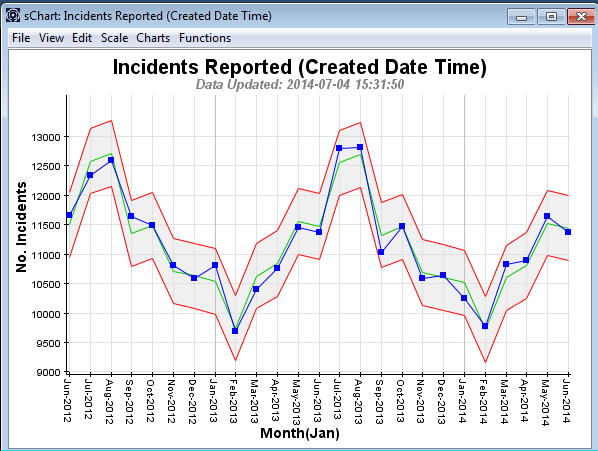
We can see that there are no signals and that the data is following a very strong seasonal pattern. This means the results are likely to be dominated by features of the past that will be replicated in the future. So we can confidently (but not with absolute certainty — there’s always risk, but in this case it is minimised by being In Control) predict what will happen in the future (unless we or the system we are examining make changes):

Thus, we can be pretty sure that the forecast for February 2015 will be around an average (green line bounded by upper and lower red guidelines) of 9,750+500 approx., and for July 2015 will be around an average of 12,500+500 approx.
BUT, if a senior executive says, “I need you to be more precise, I need one number”, you’re up against another well-respected Physicist — Heisenberg and his Uncertainty Principle. The more precise one thing you measure, the fuzzier another becomes. So asking for a forecast which is a single number only (without a range of possible values), means that the probability of it actually occurring approaches zero! Or as Dilbert says, worthless!
Categories & Tags:
Leave a comment on this post:
You might also like…

Using AI tools for your literature review
There are a proliferation of AI tools that can help you organise your life, work and study. This post focuses on academic or scholarly tools that have been developed to enhance the literature searching process, whether for independent research, an assignment or thesis. Bear in mind that these predominantly relate to finding journal/research papers, and not technical, business or trade sources such as standards, market research, industry reports or financial data. So ...

Finding successful past Cranfield theses
It’s always a good idea to look at examples of theses before you start work on your own. You may find them valuable for reading previous research, and for looking at structure, style and methodology. ...

On‑campus or off‑campus? How Cranfield students found their home away from home
Finding the right place to live is one of the biggest decisions you’ll make as you begin your student journey. Whether you’re looking for the convenience and community of living on-campus or the independence ...

Avoiding common referencing errors
As librarians, we get to see the full spectrum of reference lists in student work —from exemplary to … well, let’s just say, works still very much in progress! We are experts in spotting mistakes ...

Using your Mendeley library after you have left Cranfield
So you have spent the whole year (or more) lovingly collecting references around the topics that matter to you and now you have a large, personalised library in Mendeley Reference Manager containing all that information. ...

Referencing the use of generative AI in your work
We recognise that Artificial Intelligence (AI) has, and will increasingly, become a part of our everyday lives and that we need to adapt to it. Hopefully you will have already seen the guidance for staff ...