


Continuous Improvement – How Do You Know You’re Doing It? And Is It Working?
25/10/2019

Continuous Improvement – How Do You Know You’re Doing It? And Is It Working?
On our travels, we haven’t come across any organisation (Private or Public Sector) that either hasn’t got a Continuous Improvement Function / Department, or isn’t running multiple Continuous Improvement Programmes / Projects! And when we hear Continuous Improvement being bandied around, it sounds off very loud alarm bells in our ears! How it is done says a lot about Leadership & Organisation, Understanding Business in terms of Processes and People & Culture. But what also surprises us is the Continuous Improvement Techniques – or rather, lack of – being applied to focus effort in the right place or to demonstrate success.
Let me explain.
To measure the performance of business processes, the leading technique is to apply Extended-Statistical Process Control. And it absolutely must be Extended to handle trends and patterns that are often found in a business environment, such as daily, weekly, annual cyclicity (the last being often referred to a seasonal), amongst others. Yet in many of the so-called Continuous Improvement efforts, there is no SPC-chart to be seen!
Furthermore, all efforts we have observed at teaching SPC into a business environment deliver a vanilla manufacturing-style approach – and 6-sigma is one of these approaches. And, amongst one of the most serious errors in applying this approach is the mantra “If there are no results above or below the upper or lower control limits (referred in the manufacturing parlance as special-cause – we say ‘signals’), take no action”. This is fair enough in a manufacturing environment, where the production-line is subject to much more control than a real-world business/services environment. Early introduction of SPC techniques into the services industries were an attempt to wean business managers and executives off of binary comparisons (see previous blogs on the subject). Binary comparisons are where they compared a latest result against some other number (previous result or target) and, more often than not, exercised knee-jerk reactions which made performance worse. With this, multiple, synchronised knee-jerk reactions followed – and pretty soon you had a real Riverdance of worsening performance! But now it’s time to move on ……
So the very first start of any Continuous Improvement project should be to visualise the problem you’re trying to solve using Extended-SPC techniques and tools. One of the charts in this toolbox is what we call a Benchmark Chart which helps focus an organisation on where to start to apply Continuous Improvement. Having selected an area to start with, the next step is indeed to establish if there are any signals, and put in place means to eliminate their root-cause(s). BUT THIS IS ONLY WHERE 5% – 10% OF THE BENEFIT RESIDES – IT IS JUST THE START OF THE CONTINUOUS IMPROVEMENT JOURNEY!
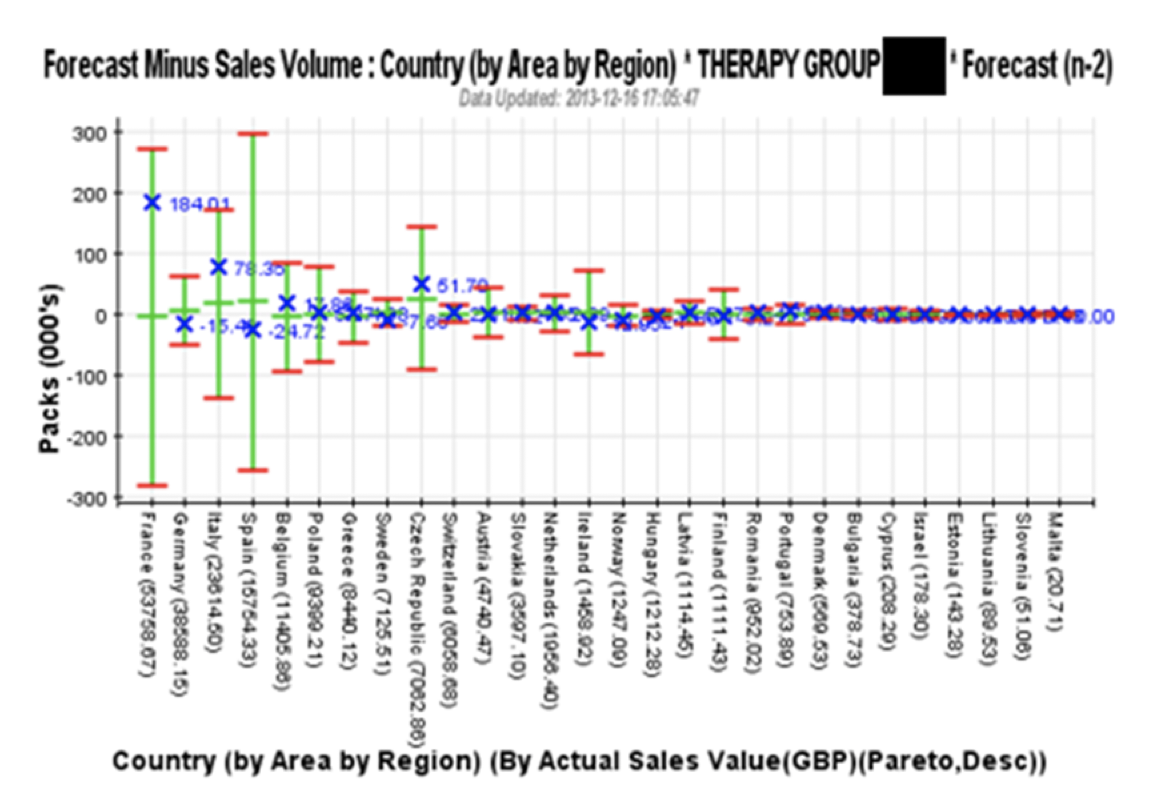
THE NEXT STEPS – THE NEXT 90% – 95% OF THE BENENFIT AVAILABLE – involve drilling down into all the results between the upper and lower control limits – we say ‘noise’ – looking for the main driver of the noise. Hence, if an organisation is truly carrying out Continuous Improvement we expect to see Benchmark Charts like this, pointing to where to focus improvement effort (in this case France which has the highest monthly value shipped (in brackets (£53,758.07)) and has the joint highest ‘noise’ (longest green bar which equates to unpredictability)):
And we expect to see charts like this, with Annotations indicating what Improvement Action was taken, first to eliminate root-causes of signals (5% – 10% £benefit), and then to reduce drivers of noise (next 90% – 95% £benefit):

Or alternatively, you can keep on employing Dogbert to tell you how his 6-sigma programmes have delivered such impressive benefits.
Categories & Tags:
Leave a comment on this post:
You might also like…

Driving the future of automotive excellence with three new scholarships
Cranfield University has a long history within the top echelon of motorsport, car development and safety designs within the automotive industry, working in the era where we’ve seen significant safety improvements, engineering feats and ...

Academic writing and being critical
Academic writing is daunting. Capturing all your thoughts and analysis and putting them down onto paper in some sort of understandable fashion is a challenge. Did you know we have resources in our Cranfield Study ...

My Cranfield experience: How studying for the Strategic Marketing MSc landed me a job in my dream industry
For Shraddha Mahapatra, studying for a postgraduate master’s degree at Cranfield School of Management unlocked the path to a career working in her dream industry sector. Shraddha had gained an MBA in her native ...

Keen to develop your study skills?
Alongside the technical skills and academic knowledge that you will gain on your course, as a Cranfield student you have the opportunity to develop a range of other skills that can enhance your learning experience. ...

From classroom to reality: Supply chain insights from Cranfield’s Manchester study tour
Each year, Cranfield University organises a study tour for MSc Logistics and Procurement & Supply Chain Management students. For the 2025–2026 cohort, students were given the option to select one of three study groups: ...

Systematic literature review – Managing duplicates
One of the questions which often comes up when discussing the SLR process is how do I manage my references in the most efficient way during the process of going from my search results to ...