


Why Performance Reporting is NOT Performance Management!
03/04/2017

“Mirror, mirror on the wall whose presentation is the fairest of them all?”
“GDP last quarter is higher than the previous quarter, and the same quarter last year”, says Kamal Ahmed of the BBC News. So far his reporting is correct. “Therefore it’s improving!”, and that’s where his performance management is wrong! The accurate thing that he can say looking at GDP data like this is “Therefore it’s different!”
There’s a massive chasm between reporting what has happened in the past and claiming it tells us about performance management – i.e. about what is likely to happen going forward. Let’s look at 3 aspects of this little conundrum:
- How can we better understand what has happened in the past (in order to take more appropriate action going forward)
- What can we say about what is likely to happen going forward (with/without any intervention)
- What are the fundamental differences between Performance Reporting and Performance Management
Let’s go back to Kamel Ahmed, and to keep things less controversial for this piece, we’ll look at GDP for the UK (figures from the World Bank – and let’s not get into which sources of figures best suit what position we want to take, or who can present the fairest of them all) on an annual basis up to and including 2011. The first thing you’ll notice is (refer back to previous posts on this matter) we are not showing % increases. The misleading reporting we hear and see around the %GDP increase this period (month, quarter, year) is x% better than last period – as if there is some God-given right that %GDP should always be increasing (we are living in a finite world!). If this was indeed the case, then we would be see raw GDP increase exponentially! That looks something like this:
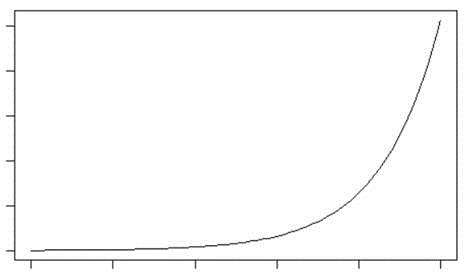
This would mean infinite raw GDP sometime soon. “Unrealistic!” you might say!
So what does raw GDP actually look like:
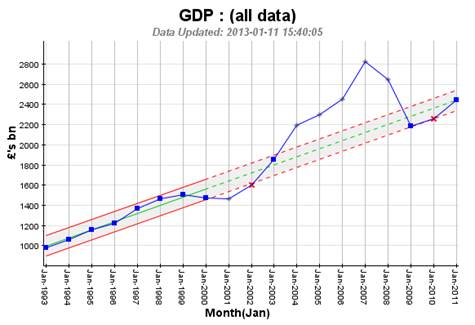
Interesting! I only have the figures back to 1993, but you have to start somewhere! We are showing the annual figures within trended (Extended-SPC, see previous posts) guidelines – and it is the pattern and trend we should look at as much as the actual individual annual results. We can see up until the credit boom in the early 2000s GDP was trending upwards at about £100bn per year (not unhealthy!). Then GDP dipped around the bursting of the “dotcom bubble”, around 2000 – 2002, and then went nuts with the credit fuelled economy. Then there was a correction (some say disaster, but, as I say, we are living in a finite world!) around 2007/2008. And guess what, the following 3 years where everyone thought we were in “plateau-land” (percentages!) GDP returned to the previous upward trend established in the earlier part of the chart.
Is this a better way of looking at Performance in order to understand it? I’ll leave that with the reader …. and next time we’ll have a look at house prices in the same way, and see if we can see a pattern. After that? We’ll attempt to answer the final two questions posed above…
David Anker
Categories & Tags:
Leave a comment on this post:
You might also like…

Building more than research: Reflections from the ECRn Symposium 2026
There’s something quietly powerful about a room full of early career researchers. Not just the ideas, although there were plenty of those—but the conversations, the curiosity, and the sense that everyone is figuring things ...

Library services over Easter, 3-6 April
Kings Norton Library will remain open for study 24/7. You will need your University ID card to enter the building and can use the self-service machines to borrow and return items as usual. Barrington Library ...

How do I access the full-text of Harvard Business Review (HBR)?
This is a frequently asked question, and it's worth knowing how to access this key management journal. So, how do you access HBR in full-text? The short answer is via our eJournals finder. You can find ...

Engineering problem to solve? Let Knovel help you find a solution
Did you know that Knovel provides you with more than just eBooks? Knovel is a key database for many engineering, mechanical and materials courses here at Cranfield University, and contains content from an extensive range ...

What happens when female scholars meet influential leaders?
On the 5 March 2026, our British Council Women in STEM Scholars had the privilege of sitting down with two excellent role models of industry and academia: Professor Dame Karen Holford, ...

From MSc to CEO: Igniting a research revolution
For many, a master’s degree is achieving a big milestone. Kilyan Ocampo, Computational Fluid Dynamics alumni shares how studying at Cranfield helped launch his career in the energy sector. Today, Kilyan ...