Visual Control Systems Connected to the Real World!
11/06/2019

Wouldn’t it be refreshing if the Visual Control Systems we use to run our businesses were as simple as that in the picture above!
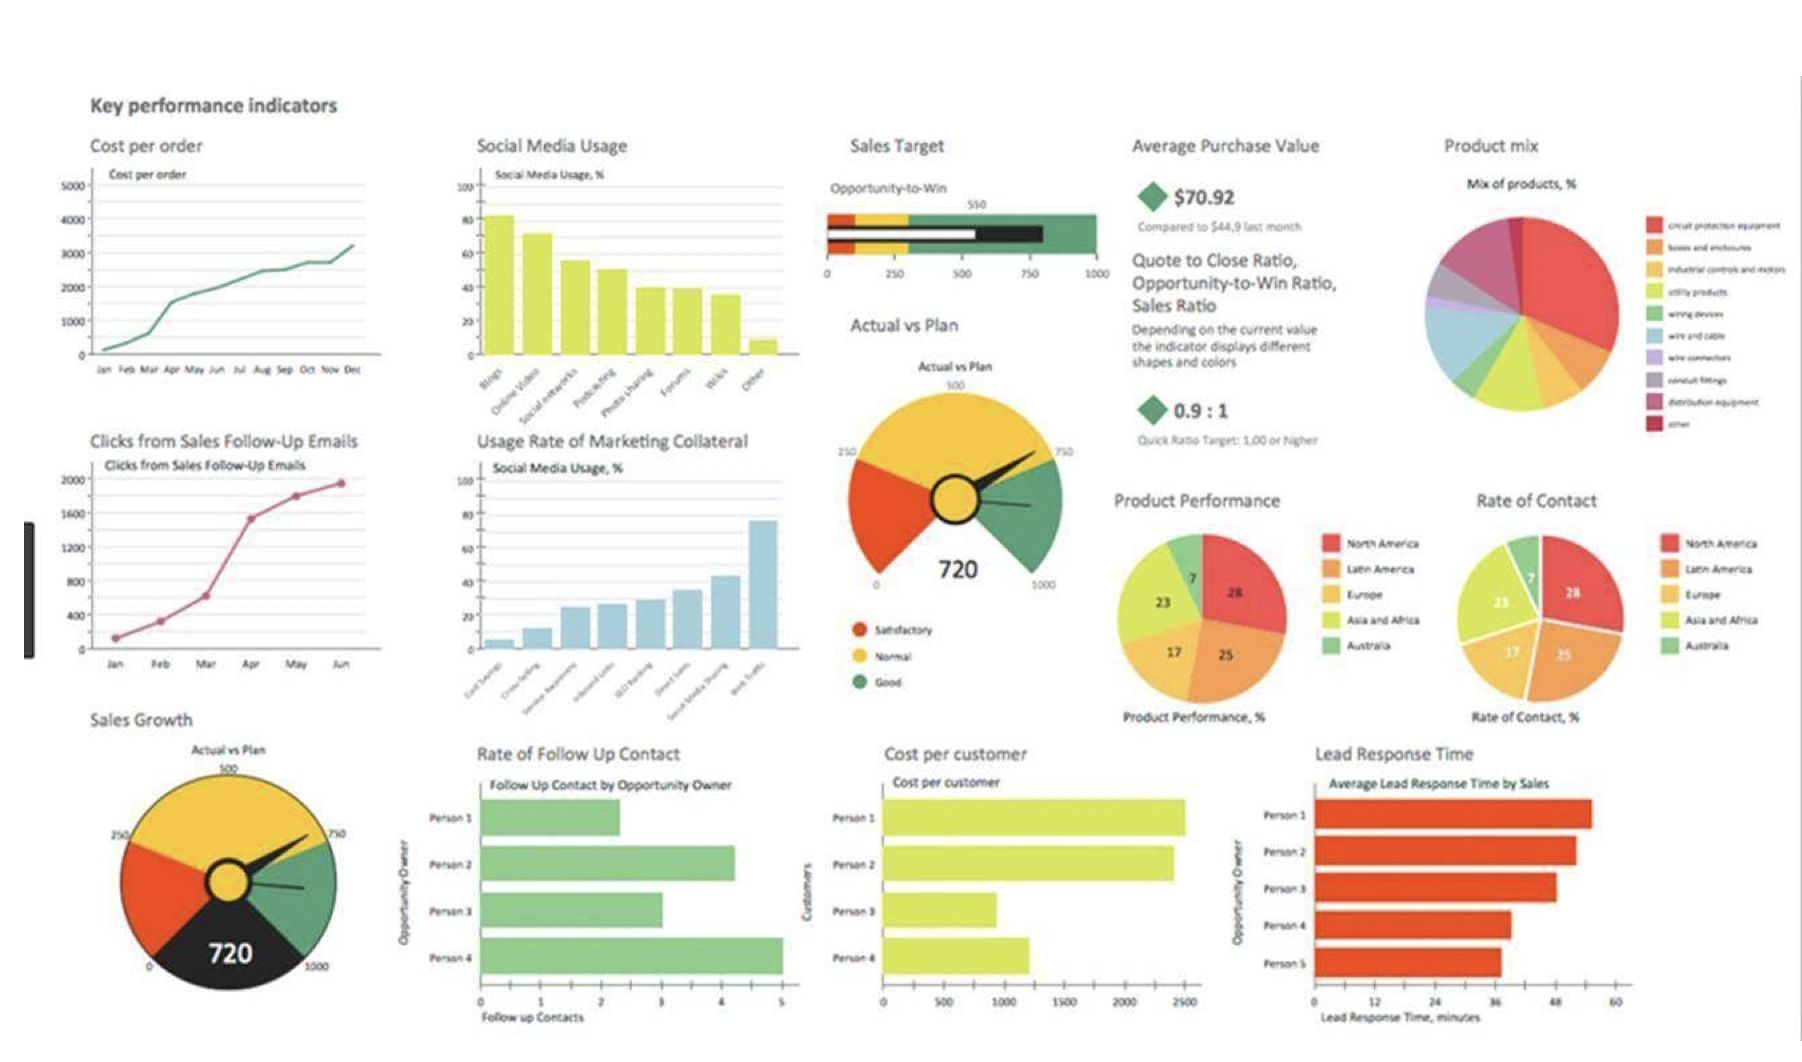
Obviously businesses are a little more complex than driving a truck on a straight road in the US, but we do come across the most elaborate schematics that are supposed to be used to drive businesses.

Although a certain prowess in use of graphics is demonstrated, some key questions leap out:
· Purpose: How do these more elaborate dashboards relate to the key Purpose or Leaders’ intent of the Organisation or Unit to which they refer?
· Line of sight: How does the Executive have any line of sight to the Front-line to be sure they’re executing the Leaders’ intent?
· Value of my contribution: How can people at the Front-line be sure that what they are doing supports or drives forward the Leaders’ intent?
· (Right) Data Driven: How can Executives and Managers out to the Front-line be sure that what they see is a true representation of the underlying data, and that the right data is being used?
· Predicted Future Direction: How does the Visual Control System help in predicting Business Performance going forward.
Canterbury District Health System has built a Visual Control System that they believe addresses each of these points both succinctly and clearly:
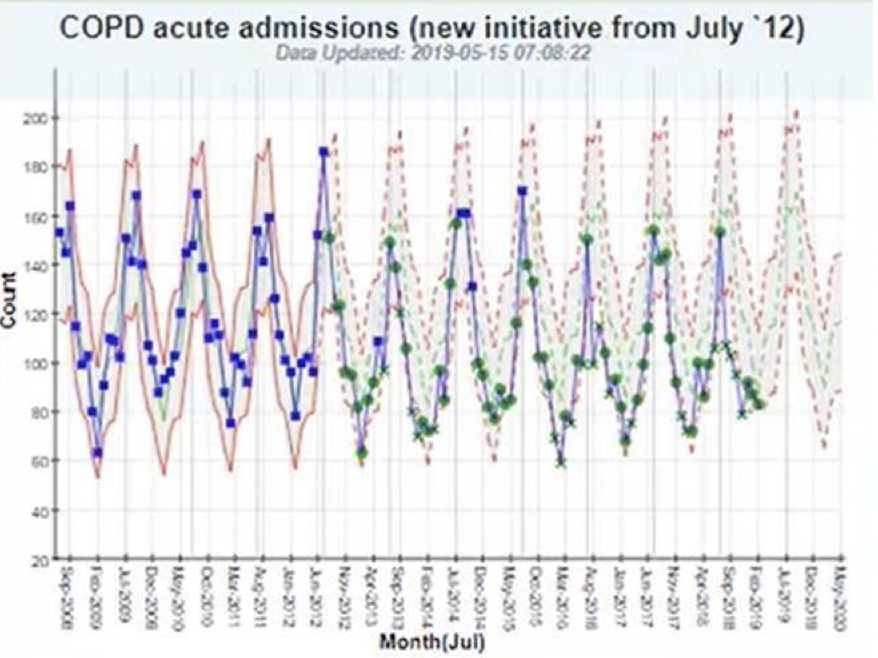
And, just to be clear, in the video, you’ll see charts like this one below, where the dashed lines going forward from the latest month’s data in February 2019, predict the volume of demand ahead for the next 12 months.

Perhaps a bit more useful than any-which-way-you can dashboards, although below you can see what happens if you ignore even the most simple of Visual Controls:
Thanks for reading …
Categories & Tags:
Leave a comment on this post:
You might also like…
Company codes – CUSIP, SEDOL, ISIN…. What do they mean and how can you use them in our Library resources?
As you use our many finance resources, you will probably notice unique company identifiers which may be codes or symbols. It is worth spending some time getting to know what these are and which resources ...
Supporting careers in defence through specialist education
As a materials engineer by background, I have always been drawn to fields where technical expertise directly shapes real‑world outcomes. Few sectors exemplify this better than defence. Engineering careers in defence sit at the ...
What being a woman in STEM means to me
STEM is both a way of thinking and a practical toolkit. It sharpens reasoning and equips us to turn ideas into solutions with measurable impact. For me, STEM has never been only about acquiring ...
A woman’s experience in environmental science within defence
When I stepped into the gates of the Defence Academy it was the 30th September 2019. I did not know at the time that this would be the beginning of a long journey as ...
Working on your group project? We can help!
When undertaking a group project, typically you'll need to investigate a topic, decide on a methodology for your investigation, gather and collate information and data, share your findings with each other, and then formally report ...
From passion to purpose: My journey at the Pinnacle of Aviation
By: Sultana Yassin Abdi MSc Air Transport Management, Current Student Born and raised in the vibrant landscape of the UAE, with roots stretching back to Somalia, my life has always been ...


Love these David, thank you. Please do mail me if you’re happy to continue to do so, I really welcome the insight.
Chris