


Performance Reporting Measures vs Performance Management Measures – Part 2
05/12/2019

Another Problem with % Measures
You may have read my blog from last week comparing Performance Reporting Measures vs Performance Management Measures.
Performance reporting is littered with measures that may appear to carry meaning for some people, but in our observations, have been misleading and impenetrable to many. And certainly don’t help understanding nor how to improve!
Here are some examples of reporting measures that we introduced previously:
- % items completed: % implies a ratio – with a numerator and denominator. E.g. % Repairs Completed defined by (Number of Repairs Completed / Total Number of Repair Calls) * 100
- % completed within some timeframe: E.g. From a previous blog’s A&E Figures, we saw % A&E attendants seen in 4 hours or under.
- Complicated Measure Combinations: E.g. % Forecast Accuracy in Supply-chain
- Applying sophisticated statistical treatment to raw performance measures that only stats specialists can read: E.g. Exponentially weighted moving averages
- Statistical representation of a population of people or things: E.g. Electric Car Use by Country
There’s one more critical problem with % measures I didn’t mention last time. And this one is particularly mind-bending, even to some of those who have studied Maths!
You start to stumble across the problem when you start drilling down into sub-sets of the data to “better understand what is going on”. So, for example, regarding A&E data, you may want to drill down by hospital and by age-group. You do this at your peril!
But, to keep this light, we’ll select an alternative example from Wikipedia that you can all go take a look at – batting percentages over two years for two baseball players. We could have picked a cricketing example, but who knows what’s happening in the Test in New Zealand right now – well I said I wanted to keep this light!
So here are the baseball figures – the figures are (number of hits) / (number of “at bats”):
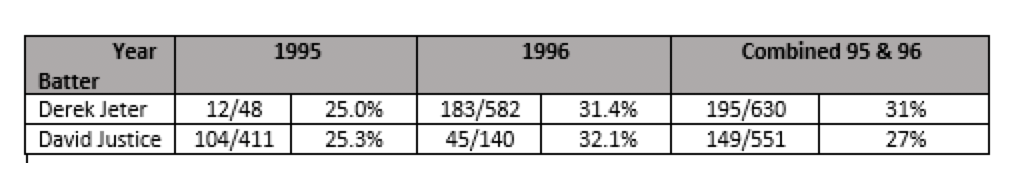
So looking at the individual year’s batting % in each of 1995 and 1996, you’d want to bet on David Justice. BUT! When you look at their combined % for the 2 years, you’d want to go with Derek Jeter. Confused?
I won’t explain this paradox here, since Wiki does a very good job of it – but it is well-known (to some mathematicians and stats guys) as Simpson’s Paradox. It happens because both the numerator and denominator can vary independently.

The ONLY way to resolve this is to have a clear PURPOSE for the business process (Wiki refers to STORY), which will guide the reader on whether to use the aggregated % or the component %s, OR to use an alternative measure altogether.
And I’m pretty sure Dilbert would encourage you to look at the underlying raw data – i.e. number of “at bats” and the “hits” separately (instead of, or, worst case, as well as %’s) if you really want to understand what’s happening!
Categories & Tags:
Leave a comment on this post:
You might also like…

Building more than research: Reflections from the ECRn Symposium 2026
There’s something quietly powerful about a room full of early career researchers. Not just the ideas, although there were plenty of those—but the conversations, the curiosity, and the sense that everyone is figuring things ...

Library services over Easter, 3-6 April
Kings Norton Library will remain open for study 24/7. You will need your University ID card to enter the building and can use the self-service machines to borrow and return items as usual. Barrington Library ...

How do I access the full-text of Harvard Business Review (HBR)?
This is a frequently asked question, and it's worth knowing how to access this key management journal. So, how do you access HBR in full-text? The short answer is via our eJournals finder. You can find ...

Engineering problem to solve? Let Knovel help you find a solution
Did you know that Knovel provides you with more than just eBooks? Knovel is a key database for many engineering, mechanical and materials courses here at Cranfield University, and contains content from an extensive range ...

What happens when female scholars meet influential leaders?
On the 5 March 2026, our British Council Women in STEM Scholars had the privilege of sitting down with two excellent role models of industry and academia: Professor Dame Karen Holford, ...

From MSc to CEO: Igniting a research revolution
For many, a master’s degree is achieving a big milestone. Kilyan Ocampo, Computational Fluid Dynamics alumni shares how studying at Cranfield helped launch his career in the energy sector. Today, Kilyan ...