


More Resources Must Mean Better Outcomes – Right? Or How Variation Can Catch You Out! Part II
02/04/2020

Introduction
This is the second part of a two-part blog around Variation and the way it can catch people out when attempting cost-cutting exercises or providing additional resources and looking for evidence of benefit.
In Part I, we looked at cost-cutting, e.g. ”Reduce your budget by 15%, and keep the same level of service”. In Part II we’ll be looking at providing additional resources and looking for hard evidence of an increase in service levels. This second approach poses additional problems over and above those outlined in Part I, and makes Priti Patel’s job rather difficult as she tries to seek to show benefit from adding 20,000 officers to a force of around 123,000 (an approx. 16% increase).
Let me explain. In the cost-cutting scenario, the “simple” requirement is to reduce costs and to keep service levels across the board at their current level. When supplying additional resources, a number of complexities can arise:
- Additional resource such as money means nothing to a business unless it is converted into one or more of (all of which take time to come on stream):
- Additional qualified personnel (e.g. fully trained and productive staff who can perform the necessary value-add operations in the Business System /Process)
- Additional assets (e.g. innovative or proven and usable technology, innovative or proven and usable methods, etc.)
- Both of which take time to deploy
- External environment – sustained events outside an organisation’s control can positively (and negatively) influence outcomes (e.g. reducing crime could be simply a regular seasonal event, long-term cyclic reductions / increases in energy costs, changes in the political landscape, health pandemics, and so on)
- Regulatory Changes – in many cases regulators can have a significant long-term impact on organisations (e.g. HMICFRS changes in crime recording, OFCOM forcing the split between openreach from BT, etc.)
- Prioritisation – where to look for improvement – with additional resources, how should they be prioritised? For example, in the Police Service, where should the additional officers be applied – suggesting that nationally, a reduction in homicides should be seen, is meaningless where homicides are a rarity; reductions in knife crime in rural Buckinghamshire would be meaningless, but perhaps not so in South London.
The above complexities are reasonably obvious to the layman, but lurking behind all this is Variation, which we noted in the previous blog is nearly always not made visible with most BI tools. In addition, though secondary in this blog, is Rework – also almost always not made visible with most BI tools.
In Part I, we introduced and described a Simulator used for educational purposes, so we’ll not repeat those details here. We’ll use this Simulator to illustrate what can happen to Outcomes when Resources are increased.
To keep this as simple as possible, we’re going to look at the Overall Completion Rate and the Overall Success Rate for 4 simulation runs, with a small amount of Variation in Stage Job Completion Time, with 5, then 6, then 7 and finally with 8 people at each Stage.
Along-side, we’ll also note Overall Utilisation Rates (multiplying Stage 1 through Stage 4 Utilisation Rates) and Work In Progress (WIP), or Jobs / Customers / Patients stuck in the System / Process to show how just this one Variation factor can influence performance:
Let’s see what Outcomes we get!Page Break
Simulation Run 1: Small Variation in Stage Job Completion Time: 5 Resources at each Stage


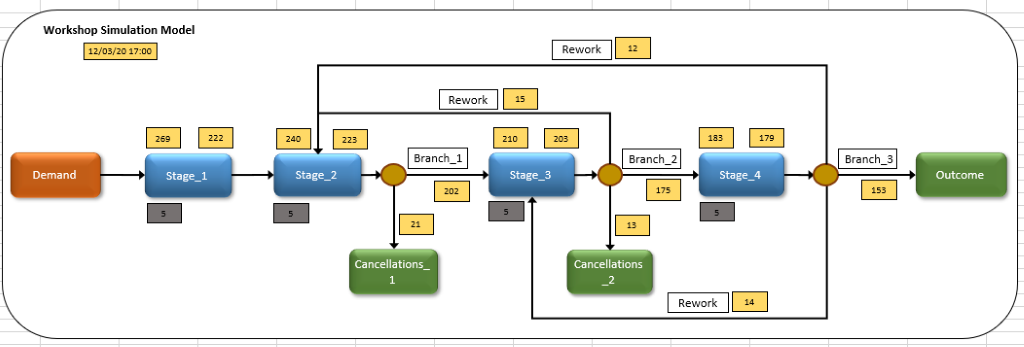
An Overall Success Rate of 5.1% was achieved in this case, with an Overall Completion Rate of 56.9%. Thinking “linearly”, one might therefore think if we increase the Resources by approx. 20% to 6 people at each Stage, then we might see a proportional increase in Overall Success Rate. The results are shown below.
Note: Overall Utilisation Rate is 50.1%, and WIP is 90 Jobs / Customers / Patients.
Simulation Run 2: Small Variation in Stage Job Completion Time: 6 Resources at each Stage


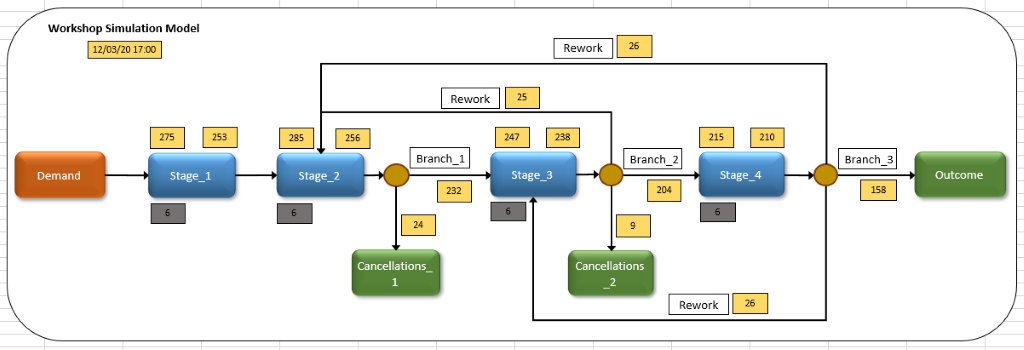
So, with a 20% uplift in Resources from 5 to 6 Servers at each Stage, we’ve almost doubled Overall Success Rate to 9.8%.
So if we add one more Server to each Stage, perhaps we can double Overall Success Rate again? The results are shown below.
Note: Overall Utilisation Rate is 46.2%, and WIP is 65 Jobs / Customers / Patients.Page Break
Simulation Run 3: Small Variation in Stage Job Completion Time: 7 Resources at each Stage


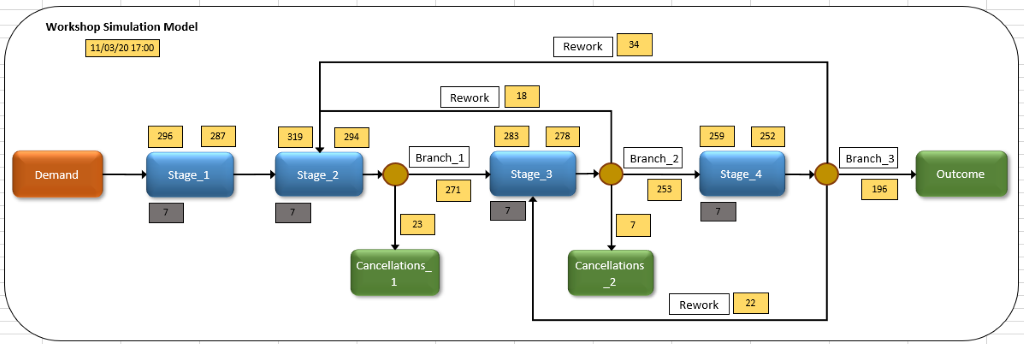
So Overall Success Rate has just over doubled again to 19.3%, with a 16% uplift from 6 to 7 Servers at each Stage. So, now, brimming with confidence we might expect that an additional Server at each Stage may get us around double again (around 40%). The results are shown below.
Note: Overall Utilisation Rate is 44.5%, and WIP is 44 Jobs / Customers / Patients.
Simulation Run 4: Small Variation in Stage Job Completion Time: 8 Resources at each Stage


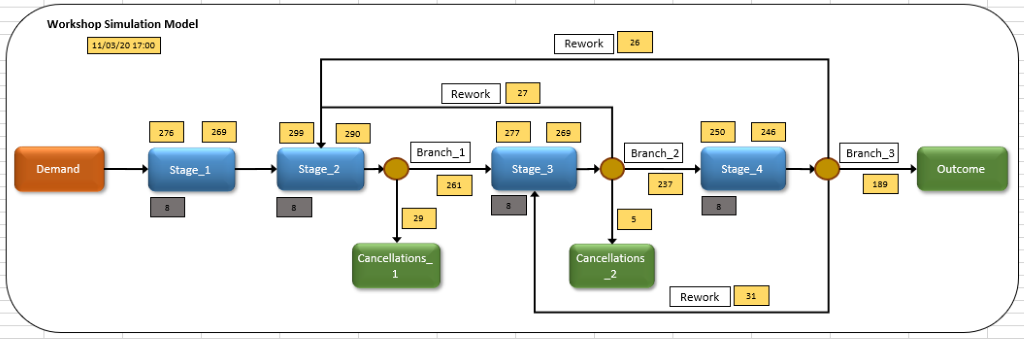
So Overall Success Rate is now 95.1% vs 19.3% with an increase of 14% in Resources from 7 Servers at each Stage to 8 at each Stage. This is more than a quadrupling in Overall Success Rate. It is this “non-linear” or difficult to predict behaviour when trying to balance Resources with Demand that is the result of hidden Variation, and which nearly always catches people out – laymen and experts alike!
Note: Overall Utilisation Rate is 22.1%, and WIP is 30 Jobs / Customers / Patients.
Page Break
Conclusion
The simple simulation runs above illustrate the complexity we are dealing with (the real world being significantly more complex).
In summary, starting with 5 Resources, Overall Success Rate was a very low 5.1%, WIP was 90, and Overall Utilisation was 50.1%. Increasing Resources by 20% from 5 to 6 improved Overall Success Rate to a (still) low 9.8%, WIP reduced to 65, and Overall Utilisation Rate decreased to 46.2%. A further increase of 16% in Resources from 6 to 7 improved Overall Success Rate to (possibly acceptable) 19.3%, WIP was 44 and Overall Utilisation Rate was 44.5%. A final increase of 14% in Resources from 7 to 8, delivered a significant improvement to Overall Success Rate of 95.1%, with WIP of 30 and Overall Utilisation Rate of 22.1%.
Furthermore, the above is just one set of possible results in the spectrum of results caused by Variation in Stage Job Completion Time.
And it’s not obvious that any organisation would be prepared to live with such low Utilisation Rates above!
Without knowing and understanding things, such as WIP and Utilisation, along with Variation, that are often not measured by organisations, simply adding Resources can deliver unpredictable Outcomes. Without knowing Utilisation Rates and WIP for each major Business Process (Incident Response, Crime & Investigation, Criminal Case Preparation etc.), in each and every of the 43 Forces nationally, simply asking the Police Service to deliver less Crime, might be a reasonable ask, but to put any specific figures on what less actually means, would be statistically criminal!
Now Dominic Cummings knows this – the question is, how many Government Ministers are aware of this?
And if Priti Patel expects to see an uplift in Outcomes as a result of a 16% uplift in Resources – she’d better be looking at this statistically, otherwise she may get it very wrong indeed!
Categories & Tags:
Leave a comment on this post:
You might also like…
Building more than research: Reflections from the ECRn Symposium 2026
There’s something quietly powerful about a room full of early career researchers. Not just the ideas, although there were plenty of those—but the conversations, the curiosity, and the sense that everyone is figuring things ...

Library services over Easter, 3-6 April
Kings Norton Library will remain open for study 24/7. You will need your University ID card to enter the building and can use the self-service machines to borrow and return items as usual. Barrington Library ...

How do I access the full-text of Harvard Business Review (HBR)?
This is a frequently asked question, and it's worth knowing how to access this key management journal. So, how do you access HBR in full-text? The short answer is via our eJournals finder. You can find ...

Engineering problem to solve? Let Knovel help you find a solution
Did you know that Knovel provides you with more than just eBooks? Knovel is a key database for many engineering, mechanical and materials courses here at Cranfield University, and contains content from an extensive range ...

What happens when female scholars meet influential leaders?
On the 5 March 2026, our British Council Women in STEM Scholars had the privilege of sitting down with two excellent role models of industry and academia: Professor Dame Karen Holford, ...

From MSc to CEO: Igniting a research revolution
For many, a master’s degree is achieving a big milestone. Kilyan Ocampo, Computational Fluid Dynamics alumni shares how studying at Cranfield helped launch his career in the energy sector. Today, Kilyan ...