


Media Reporting & Kindergarten Statistics
22/07/2019

The BBC reported this problem less than a week ago
It dished up the usual typical fayre of poor analysis of the available data.
When you put the data (which is published yearly back to 1996) into useful software, you get the sChart below. The data is in blue. The statistically calculated trended averages are the green lines. The upper and lower performance guidelines (outlining the performance corridor) are the red lines. The dotted red and green lines are the predictions of the performance corridor going forwards.
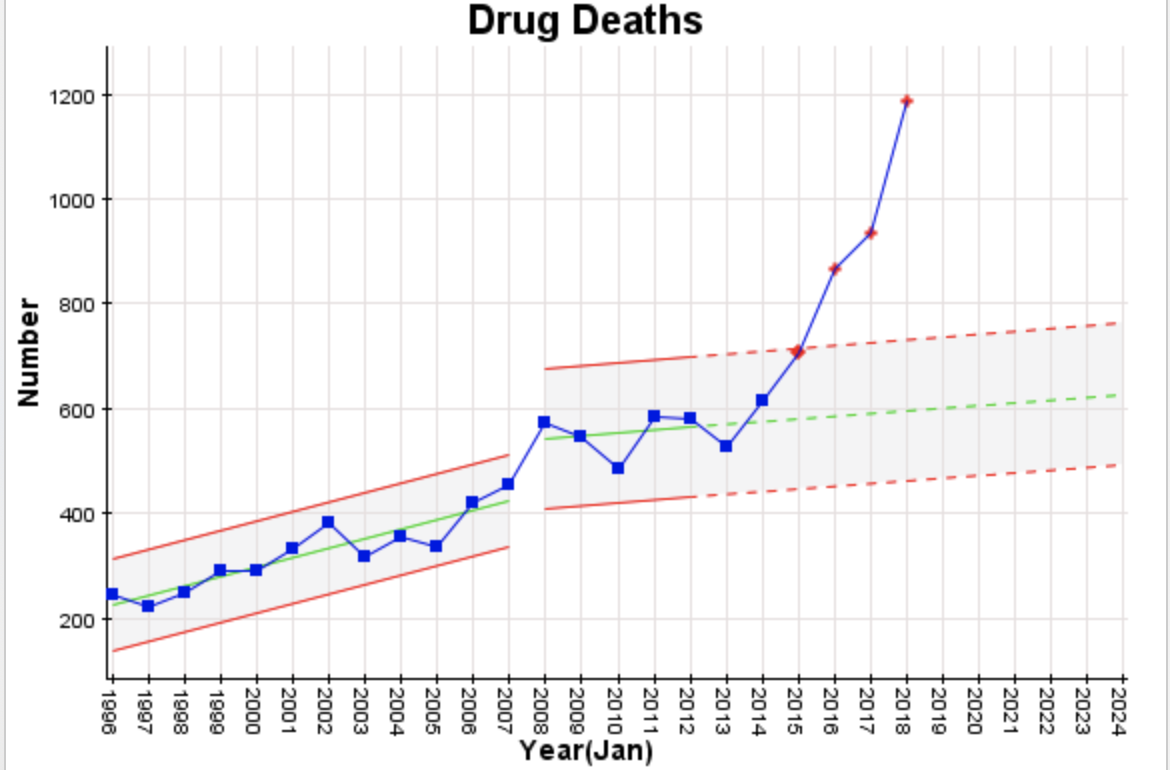
The problem started who knows how long ago with an increasing trend (of around 18 deaths per year) being set from 1996 (when we first have available data). In 2008, there was an upshift of almost 100 deaths per year but with a much reduced trend (5 – 6 per year) upwards. The first thing that comes to mind to cause the shift and the reduced trend, is the change in Scotland’s approach to drugs – see https://www.gov.scot/publications/road-recovery-new-approach-tackling-scotlands-drug-problem/pages/6/
But there could be other causes.
Things turned really nasty, though, from 2015 / 2016 onwards – so getting excited now is at least 3 – 4 years too late. Looking at the media comments / articles on this over the years it seems each year there’s noise and poor analysis about increasing drug deaths, and no preventative action, or if there is action being taken, it’s not working or possibly making things worse!
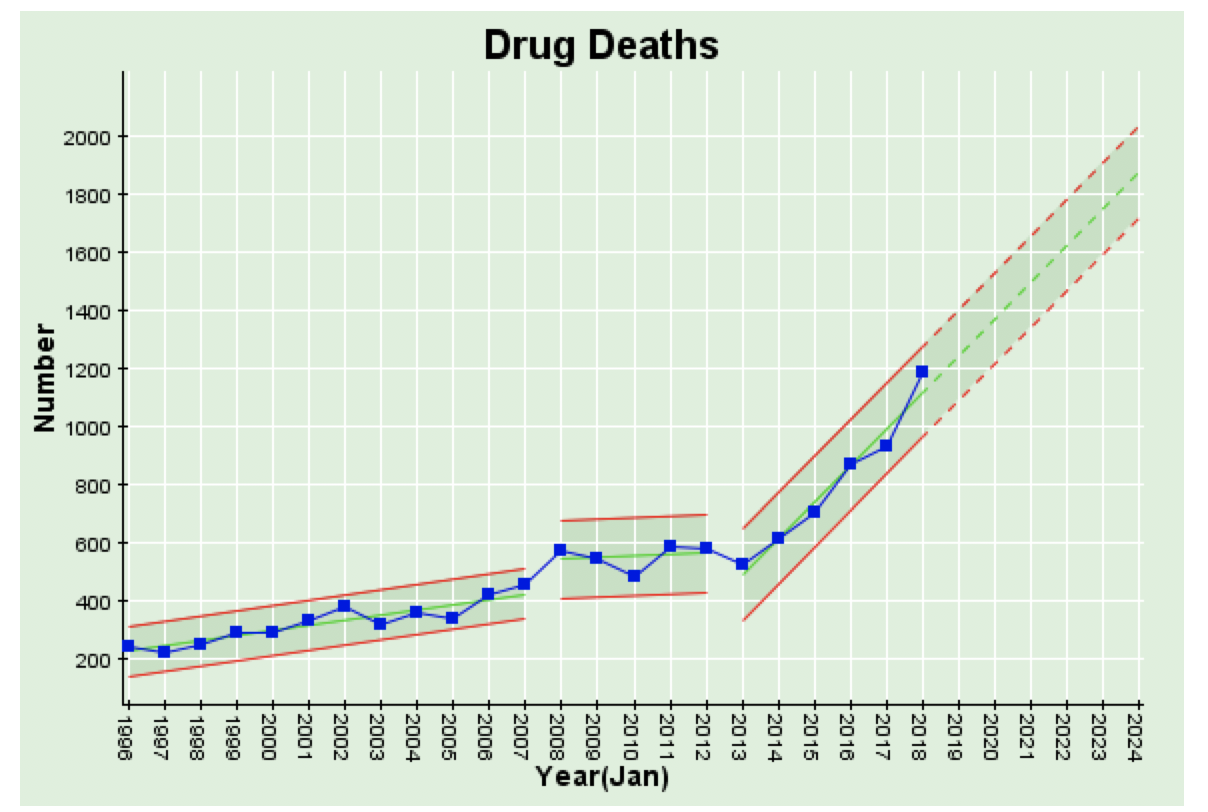
If we project the latest trend forwards by 5 years we see an increasing trend now of 126 per year! So if you think 1,200 is bad now, wait 2024 when it will be almost 2,000 per year!
To help Scotland get to the bottom of this, we might want to start with straightening out the way the BBC reports data and statistics! And let’s not wait until 2024!
Categories & Tags:
Leave a comment on this post:
You might also like…

Building more than research: Reflections from the ECRn Symposium 2026
There’s something quietly powerful about a room full of early career researchers. Not just the ideas, although there were plenty of those—but the conversations, the curiosity, and the sense that everyone is figuring things ...

Library services over Easter, 3-6 April
Kings Norton Library will remain open for study 24/7. You will need your University ID card to enter the building and can use the self-service machines to borrow and return items as usual. Barrington Library ...

How do I access the full-text of Harvard Business Review (HBR)?
This is a frequently asked question, and it's worth knowing how to access this key management journal. So, how do you access HBR in full-text? The short answer is via our eJournals finder. You can find ...

Engineering problem to solve? Let Knovel help you find a solution
Did you know that Knovel provides you with more than just eBooks? Knovel is a key database for many engineering, mechanical and materials courses here at Cranfield University, and contains content from an extensive range ...

What happens when female scholars meet influential leaders?
On the 5 March 2026, our British Council Women in STEM Scholars had the privilege of sitting down with two excellent role models of industry and academia: Professor Dame Karen Holford, ...

From MSc to CEO: Igniting a research revolution
For many, a master’s degree is achieving a big milestone. Kilyan Ocampo, Computational Fluid Dynamics alumni shares how studying at Cranfield helped launch his career in the energy sector. Today, Kilyan ...