


Data Visualisation, Fantastic Beasts and Where to Find Them
28/11/2018

Data Visualisation, Fantastic Beasts and Where to Find Them
Wikipedia: Data visualisation is viewed by many disciplines as a modern equivalent of visual communication. It involves the creation and study of the visualrepresentation of data. According to Friedman (2008) the “main goal of data visualisation is to communicate information clearly and effectively through graphical means”.
CGI in films today pushes data visualisation to its limits, and many graphical presentation tools today allow even the most unskilled to develop “killer” presentations. But Friedman goes on to say “….. yet designers often fail to achieve a balance between form and function, creating gorgeous data visualisations which fail to serve their main purpose — to communicate information”. So in business, we’re not here to entertain (although there are exceptions!), but to use information to make decisions.
Wiki goes on to describe Visual Control: Visual control is a business management technique employed in many places where information is communicated by using visual signals instead of texts or other written instructions ….. Visual control methods aim to increase the efficiency and effectiveness of a process by making the steps in that process more visible …. Another aspect of visual control is that everyone is given the same visual cues and so are likely to have the same vantage point … A visual control system must have an action component associated with it … therefore, visual controls must also have a component where immediate feedback is provided to workers.
What does a Visual Control System look like?
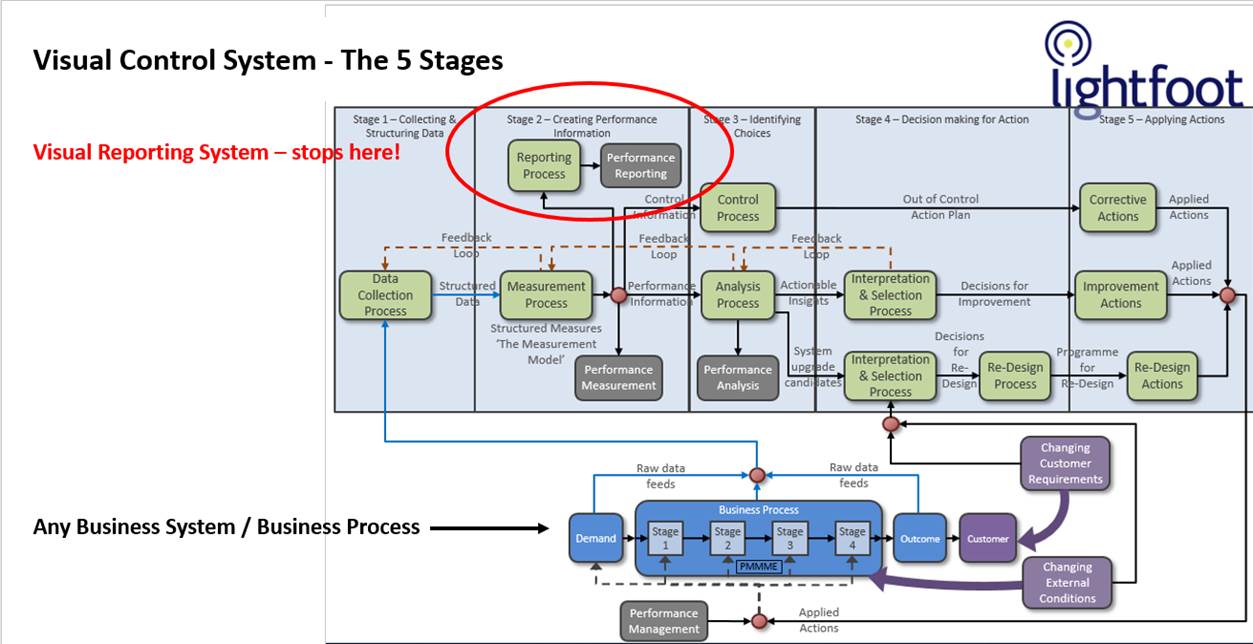
A Visual Control System – some prefer the term “Gantry View” or “Cockpit View” – comprises 5 key Stages, namely: 1. Data Collection and Structuring of Data; 2. Creating and Visualising Performance Information; 3. Identifying Choices (of Action); 4. Decision-making (for Action); 5. Applying Action. And Performance Management is where the “rubber meets the road” – so to speak. It’s actually applying the agreed actions to the business process. Where is Feedback on the success or otherwise of the Action taken in all this? Well that comes back in the form of data from whatever the business process is that you are expecting to improve. Hence, we have a closed-loop (not the Matthew Syed definition) – a Visual Control System.
The problem with most organisations is that they stop at delivering a Visual Reporting System, with no clear linkages to managing performance of the system or processes. But creative Visual Reporting – “generating gorgeous data visualisations” – can consume many resources, can be highly entertaining and can generate much activity, rather like Fantastic Beasts – but is that really the main purpose?
Categories & Tags:
Leave a comment on this post:
You might also like…

Building more than research: Reflections from the ECRn Symposium 2026
There’s something quietly powerful about a room full of early career researchers. Not just the ideas, although there were plenty of those—but the conversations, the curiosity, and the sense that everyone is figuring things ...

Library services over Easter, 3-6 April
Kings Norton Library will remain open for study 24/7. You will need your University ID card to enter the building and can use the self-service machines to borrow and return items as usual. Barrington Library ...

How do I access the full-text of Harvard Business Review (HBR)?
This is a frequently asked question, and it's worth knowing how to access this key management journal. So, how do you access HBR in full-text? The short answer is via our eJournals finder. You can find ...

Engineering problem to solve? Let Knovel help you find a solution
Did you know that Knovel provides you with more than just eBooks? Knovel is a key database for many engineering, mechanical and materials courses here at Cranfield University, and contains content from an extensive range ...

What happens when female scholars meet influential leaders?
On the 5 March 2026, our British Council Women in STEM Scholars had the privilege of sitting down with two excellent role models of industry and academia: Professor Dame Karen Holford, ...

From MSc to CEO: Igniting a research revolution
For many, a master’s degree is achieving a big milestone. Kilyan Ocampo, Computational Fluid Dynamics alumni shares how studying at Cranfield helped launch his career in the energy sector. Today, Kilyan ...
Thank you David. I do enjoy these, thank you for sending them.
Chris