Why Performance Reporting is NOT Performance Management! – Part 6/6
05/06/2017


Courtesy of Dilbert (Scott Adams 08 May 2008).
Does it seem like Performance Reporting is using numbers that you can’t understand, can’t work out where they came from or are just plain different from the numbers you have in your spreadsheet? This is just one of the issues with Performance Reporting where the numbers have been “managed to aid understanding” of course!
This is our final post on this topic (for now!). Over the past 5 posts, we introduced the idea that Performance Reporting is not Performance Management and started to examine 3 aspects of this little conundrum:
- How can we better understand what has happened in the past (in order to take more appropriate action going forward)
- What can we say about what is likely to happen going forward (with/without any intervention)
- What are the fundamental differences between Performance Reporting and Performance Management
We’ve looked at the first 2 bullets and we’ve started exploring the final bullet in some detail – What are the fundamental differences between Performance Reporting and Performance Management.
We pictured a Business Process (no matter whether private or public sector) showing the classic approach to Performance Reporting and Analysis that achieves little in actually improving the Business Process.
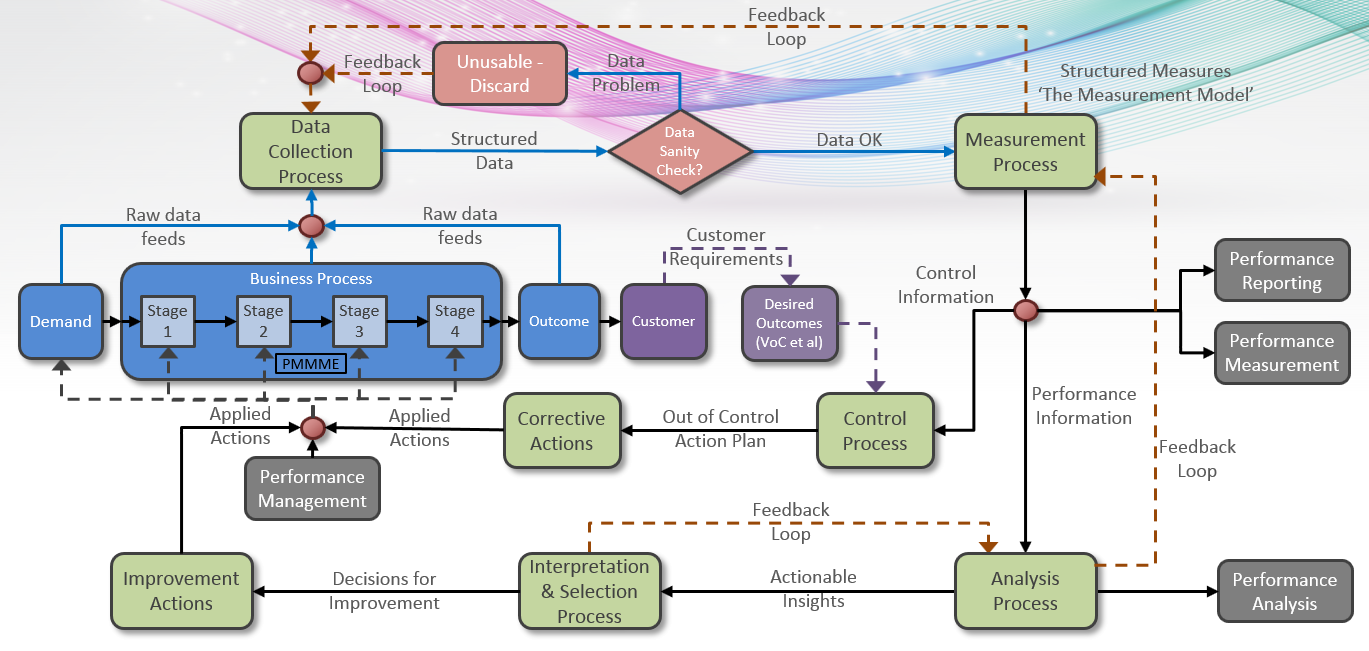
We then modified the picture, transforming the effectiveness and productivity of those involved in Performance Management. The new picture introduced a Measurement Process and associated Measurement Model feeding forward into Performance Measurement and Performance Analysis (as well as Reporting). From the Analysis we generated Actionable Insights to go into Interpretation and Selection for Improvement Decisions followed by Actions on the Business Process – along with Monitoring and back around the loop for Performance Analysis to decide if the Improvement Action is actually having the desired impact. Crucial Feed-back loops were also introduced.
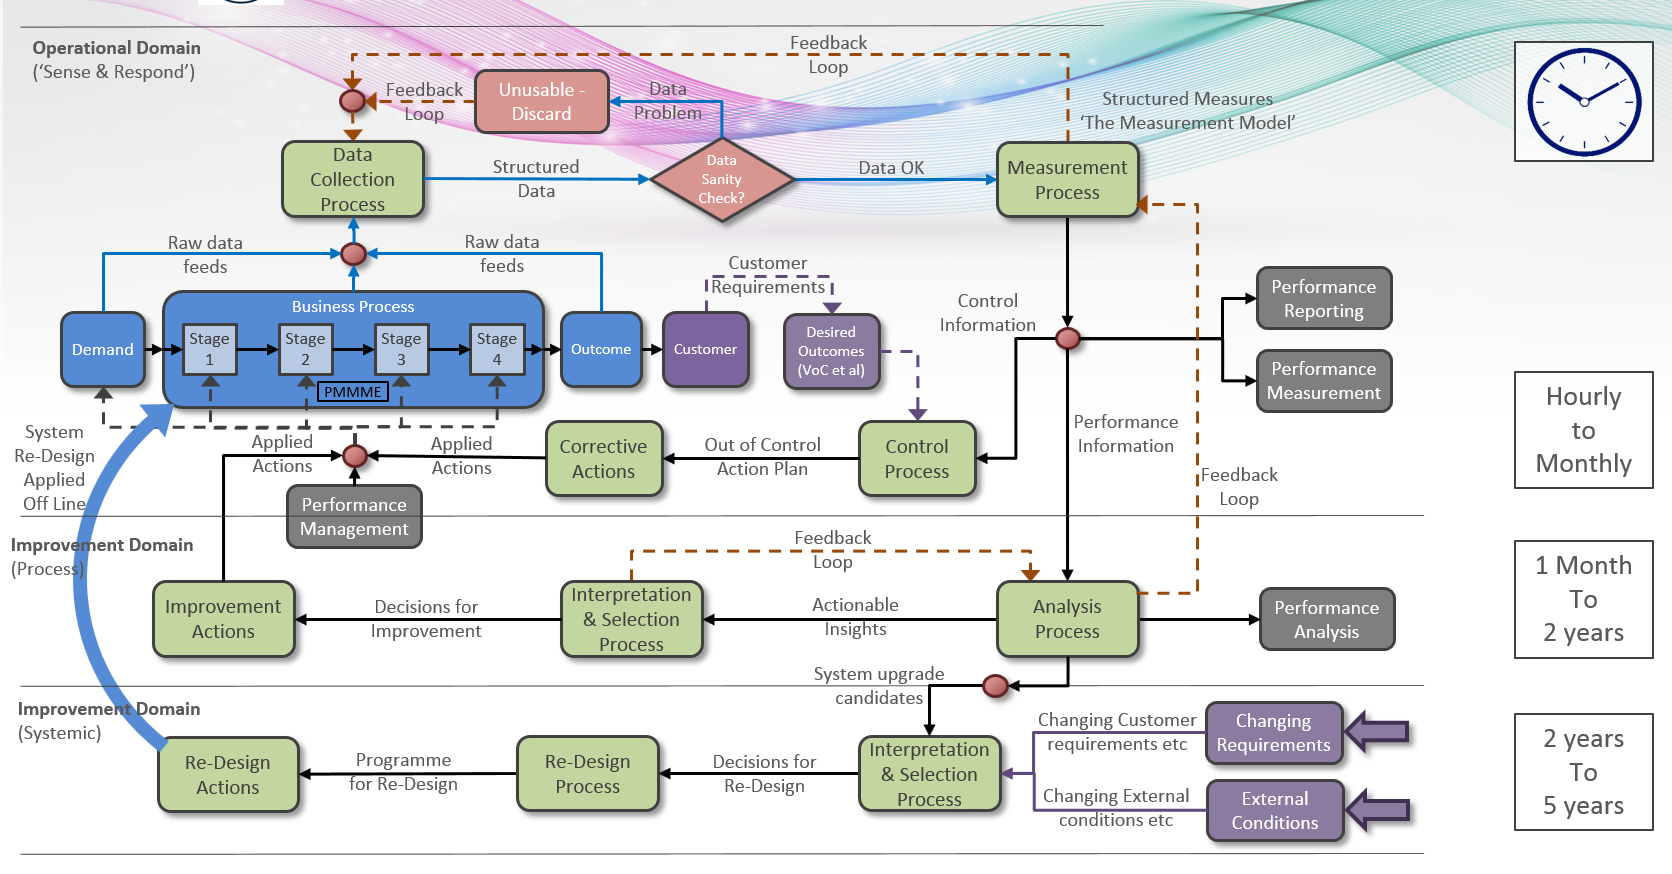
Next we introduced the idea of managing performance in different timescales (see below) where, as well as the longer time-frame of Continuous Improvement, we introduced the shorter Sense & Respond (or Operational ) Timeframe – both feeding off the same Measurement Model (and therefore the same data) , but at different levels of aggregation in time.

When the short time-scale Sense & Respond loop and the medium time-scale Process Improvement loop are not recognised and considered separately, management interference can set in and turn things into a “buggers’ muddle”.
The final step that we’ll look at now that completes the picture delivering a coherent and integrated approach to Performance Measurement and Management is the longer Systemic Change / Requirements Change timeframe (see below).

This longer Systemic Improvement Domain takes into account Changing Requirements (such as changes made by HMIC/Home Office on Police, or changing military requirements over the period of a long Defence Systems project) as well as changing External Conditions (such as the shift from street crime to cybercrime, or new technology enabling self-driving cars etc.). These will be supplemented by longer-term “System Upgrade” candidates (e.g. the ability to change out Stages in the Business Process) fed from the same data as Sense & Respond and Process Improvement, but aggregated to longer time-scales , all feeding into an Interpretation & Selection Process. From here, Decisions on Re-design will be fed into a series of Programmes that will apply these changes to the Business System.
And finally, for clarity, the 3 Time-scales are shown indicatively on the right of the diagram as guidance on when these 3 Types of changes (Sense & Respond, Process Improvement, Systemic Improvement) occur.
And there you have it – a complete Performance Management System…..
Or you can just make the numbers up!
Categories & Tags:
Leave a comment on this post:
You might also like…
Company codes – CUSIP, SEDOL, ISIN…. What do they mean and how can you use them in our Library resources?
As you use our many finance resources, you will probably notice unique company identifiers which may be codes or symbols. It is worth spending some time getting to know what these are and which resources ...
Supporting careers in defence through specialist education
As a materials engineer by background, I have always been drawn to fields where technical expertise directly shapes real‑world outcomes. Few sectors exemplify this better than defence. Engineering careers in defence sit at the ...
What being a woman in STEM means to me
STEM is both a way of thinking and a practical toolkit. It sharpens reasoning and equips us to turn ideas into solutions with measurable impact. For me, STEM has never been only about acquiring ...
A woman’s experience in environmental science within defence
When I stepped into the gates of the Defence Academy it was the 30th September 2019. I did not know at the time that this would be the beginning of a long journey as ...
Working on your group project? We can help!
When undertaking a group project, typically you'll need to investigate a topic, decide on a methodology for your investigation, gather and collate information and data, share your findings with each other, and then formally report ...
From passion to purpose: My journey at the Pinnacle of Aviation
By: Sultana Yassin Abdi MSc Air Transport Management, Current Student Born and raised in the vibrant landscape of the UAE, with roots stretching back to Somalia, my life has always been ...


