


Performance Reporting Measures vs Performance Management Measures
29/11/2019

You may have read my blog from last week about A&E Wait Times. We indicated that the way these kinds of figures are reported, out of context, is hopeless in actually understanding what is going on.
But the problem doesn’t stop there. There is a fundamental problem with performance reporting, and the measures you see being utilised there, versus performance management and the measures being utilised here!
Let me explain.
Performance management requires you to understand the behaviour of business processes and make interventions to improve them. This implies that you use a small set of specific measures that we’ve blogged about before – see previous bloghttps://blogs.cranfield.ac.uk/leadership-management/cbp/the-future-of-operational-performance-management-part-3
For example, these performance management measures would include number of items coming into a process, number leaving a process, throughput time and so on.
Performance reporting is littered with measures that may appear to carry meaning for some people, but in our observations, have been misleading and impenetrable to many. And certainly don’t help understanding nor how to improve!
Here are some examples of reporting measures:
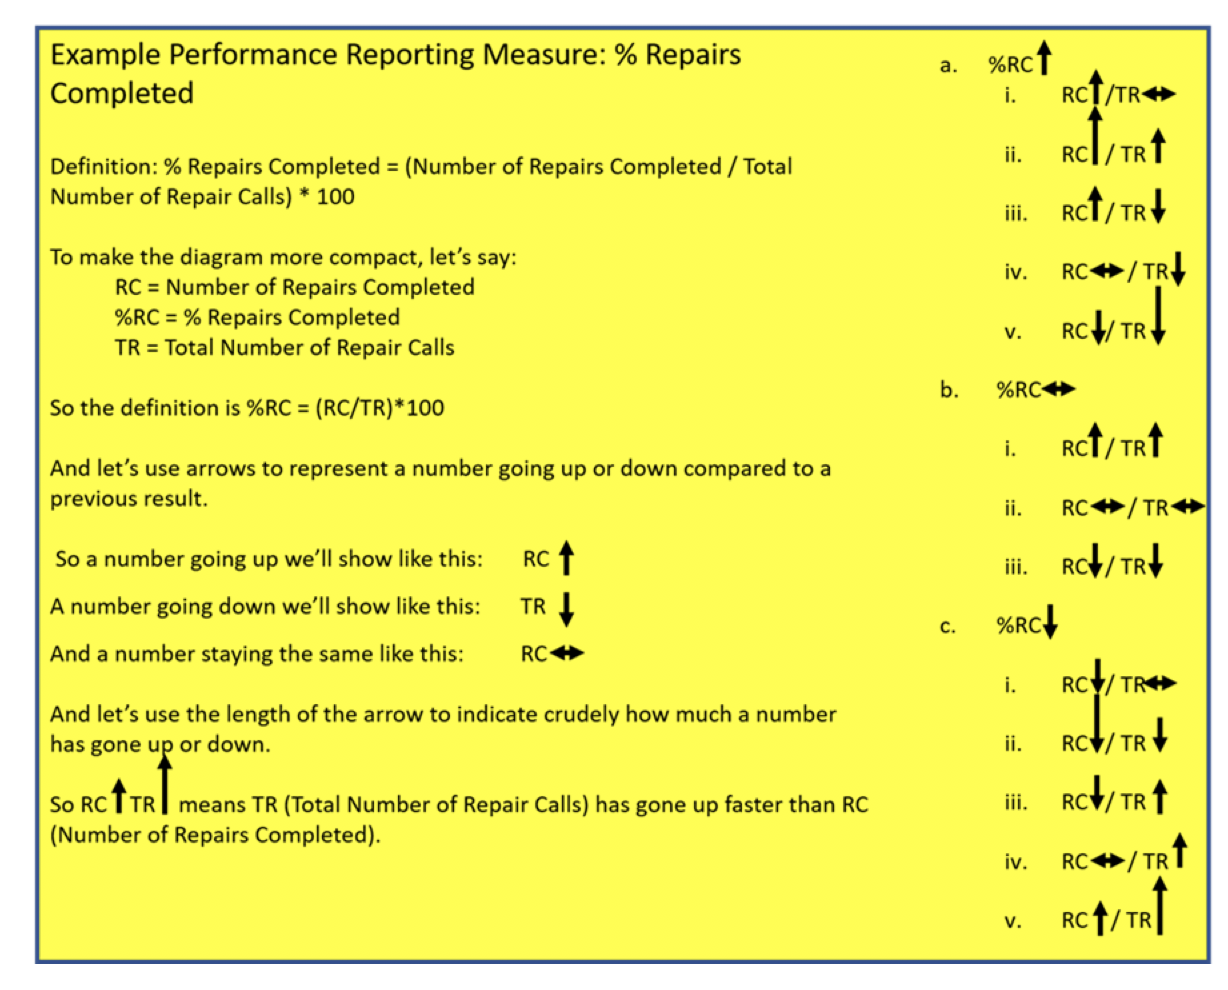
- % items completed: % implies a ratio – with a numerator and denominator. E.g. % Repairs Completed defined by (Number of Repairs Completed / Total Number of Repair Calls) * 100
- % completed within some timeframe: E.g. From last week’s A&E Figures, we saw % A&E attendants seen in 4 hours or under.
- Complicated Measure Combinations: E.g. % Forecast Accuracy in Supply-chain
- Applying sophisticated statistical treatment to raw performance measures that only stats specialists can read: E.g. Exponentially weighted moving averages
- Statistical representation of a population of people or things: E.g. Electric Car Use by Country
In today’s blog, we’ll look at why %’s are a problem (the argument is exactly the same for ratios) in trying to understand what is going on?
- % Repairs Completed: Let’s assume more is good and less is bad. Here’s how complicated we have made it to understand what is going on (see yellow box):
- % Repairs Completed has gone up (since it was last reported on). There are five different combinations of Number of Repairs Completed vs Total Number of Repair Calls:
i. Number of Repairs Completed has increased; Total Number of Repair Calls stays the same
ii. Number of Repairs Completed has increased; Total Number of Repair Calls increases, but at a slower rate
iii. Number of Repairs Completed has increased; Total Number of Repair Calls has decreased
iv. Number of Repairs Completed stays the same; Total Number of Repair Calls has decreased
v. Number of Repairs Completed has decreased; Total Number of Repair Calls decreases, but at a faster rate
- % Repairs Completed remains the same (since it was last reported on). There are three combinations of Number of Repairs Completed vs Total Number of Repair Calls:
i. Number of Repairs Completed has increased; Total Number of Repair Calls also increases at the same rate
ii. Number of Repairs Competed stays the same; Total Number of Repair Calls also stays the same
iii. Number of Repairs Completed has decreased; Total Number of Repair Calls also decreases at the same rate
- % Repairs Completed has gone down (since it was last reported on). There are five different combinations of Number of Repairs Completed vs Total Number of Repair Calls:
i. Number of Repairs Completed has decreased; Total Number of Repair Calls stays the same
ii. Number of Repairs Completed has decreased; Total Number of Repair Calls decreases, but at a slower rate
iii. Number of Repairs Completed has decreased; Total Number of Repair Calls has increased
iv. Number of Repairs Completed stays the same; Total Number of Repair Calls has increased
v. Number of Repairs Completed has increased; Total Number of Repair Calls increases, but at a faster rate
So, when we are performance managing, each of our two performance management measures can move one of 3 ways – go up, stay the same or go down. Simples!

But, when we are performance reporting, our one % reporting measure can move through any one of the 13 different combinations above! And I think Dilbert would have something to say about that!
And where %’s do come into their own is when drilling down using tools such as Pareto Charts to find root-causes of signals or drivers of patterns – more on this in our future blogs.
Why is the second example above – A&E attendances seen within 4 hours – a problem in trying to understand what is going on? For that you’ll need to read our next blog…
Categories & Tags:
Leave a comment on this post:
You might also like…

Referencing the use of generative AI in your work
We recognise that Artificial Intelligence (AI) has, and will increasingly, become a part of our everyday lives and that we need to adapt to it. Hopefully you will have already seen the guidance for staff ...

Finding part-time work whilst studying at Cranfield – is it right for you?
We know that the cost of living in the UK is a real and ongoing challenge for many students. Whether you are still considering postgraduate study or already preparing for life at university, you ...

Leaving Cranfield soon? Have you heard about Alumni Library Online?
We are proud to offer one of the UK’s leading university library services for alumni. Alumni Library Online gives you instant access to thousands of top quality journal articles and the latest thinking to support ...

Want to know more about research methods?
Research methods are the strategies and tools used to gather, analyse and interpret data or evidence to uncover new information or create better understanding of a topic. Research methodology is the theory, justification and assumptions ...

Come for Cranfield, stay for Milton Keynes: how Bucks, Beds and the OxCam region are just getting started
Heard the one about the entry-level job that needed three years of experience? Sadly we all have, and that’s why in a jobs market where practical, hands-on experience is so important, study where collaboration ...

British Standards and ISO standards demystified
We are frequently asked how to find ISO (International Standards Organisation) standards. The best way to find them is to go straight to our British Standards Online (BSOL) service. Why go to British Standards if you ...