


Continuous Improvement – How Do You Know You’re Doing It? And Is It Working?
25/10/2019

Continuous Improvement – How Do You Know You’re Doing It? And Is It Working?
On our travels, we haven’t come across any organisation (Private or Public Sector) that either hasn’t got a Continuous Improvement Function / Department, or isn’t running multiple Continuous Improvement Programmes / Projects! And when we hear Continuous Improvement being bandied around, it sounds off very loud alarm bells in our ears! How it is done says a lot about Leadership & Organisation, Understanding Business in terms of Processes and People & Culture. But what also surprises us is the Continuous Improvement Techniques – or rather, lack of – being applied to focus effort in the right place or to demonstrate success.
Let me explain.
To measure the performance of business processes, the leading technique is to apply Extended-Statistical Process Control. And it absolutely must be Extended to handle trends and patterns that are often found in a business environment, such as daily, weekly, annual cyclicity (the last being often referred to a seasonal), amongst others. Yet in many of the so-called Continuous Improvement efforts, there is no SPC-chart to be seen!
Furthermore, all efforts we have observed at teaching SPC into a business environment deliver a vanilla manufacturing-style approach – and 6-sigma is one of these approaches. And, amongst one of the most serious errors in applying this approach is the mantra “If there are no results above or below the upper or lower control limits (referred in the manufacturing parlance as special-cause – we say ‘signals’), take no action”. This is fair enough in a manufacturing environment, where the production-line is subject to much more control than a real-world business/services environment. Early introduction of SPC techniques into the services industries were an attempt to wean business managers and executives off of binary comparisons (see previous blogs on the subject). Binary comparisons are where they compared a latest result against some other number (previous result or target) and, more often than not, exercised knee-jerk reactions which made performance worse. With this, multiple, synchronised knee-jerk reactions followed – and pretty soon you had a real Riverdance of worsening performance! But now it’s time to move on ……
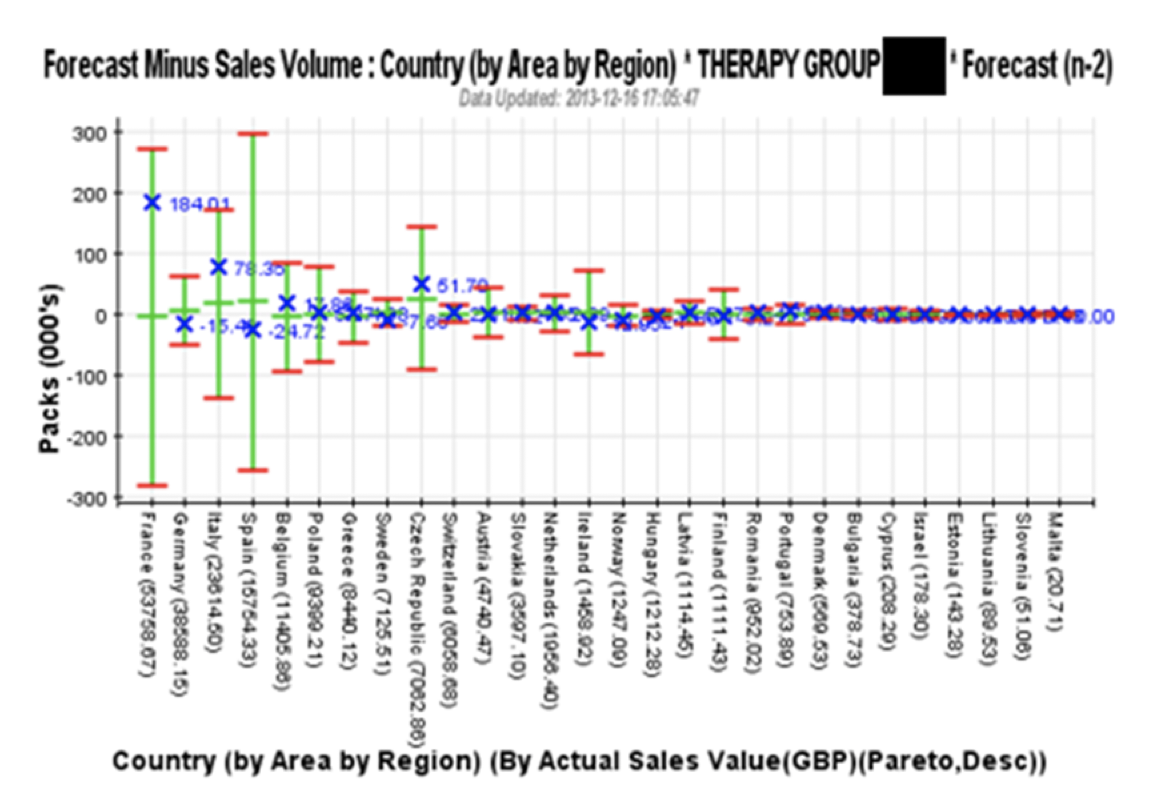
So the very first start of any Continuous Improvement project should be to visualise the problem you’re trying to solve using Extended-SPC techniques and tools. One of the charts in this toolbox is what we call a Benchmark Chart which helps focus an organisation on where to start to apply Continuous Improvement. Having selected an area to start with, the next step is indeed to establish if there are any signals, and put in place means to eliminate their root-cause(s). BUT THIS IS ONLY WHERE 5% – 10% OF THE BENEFIT RESIDES – IT IS JUST THE START OF THE CONTINUOUS IMPROVEMENT JOURNEY!
THE NEXT STEPS – THE NEXT 90% – 95% OF THE BENENFIT AVAILABLE – involve drilling down into all the results between the upper and lower control limits – we say ‘noise’ – looking for the main driver of the noise. Hence, if an organisation is truly carrying out Continuous Improvement we expect to see Benchmark Charts like this, pointing to where to focus improvement effort (in this case France which has the highest monthly value shipped (in brackets (£53,758.07)) and has the joint highest ‘noise’ (longest green bar which equates to unpredictability)):
And we expect to see charts like this, with Annotations indicating what Improvement Action was taken, first to eliminate root-causes of signals (5% – 10% £benefit), and then to reduce drivers of noise (next 90% – 95% £benefit):

Or alternatively, you can keep on employing Dogbert to tell you how his 6-sigma programmes have delivered such impressive benefits.
Categories & Tags:
Leave a comment on this post:
You might also like…
Building more than research: Reflections from the ECRn Symposium 2026
There’s something quietly powerful about a room full of early career researchers. Not just the ideas, although there were plenty of those—but the conversations, the curiosity, and the sense that everyone is figuring things ...

Library services over Easter, 3-6 April
Kings Norton Library will remain open for study 24/7. You will need your University ID card to enter the building and can use the self-service machines to borrow and return items as usual. Barrington Library ...

How do I access the full-text of Harvard Business Review (HBR)?
This is a frequently asked question, and it's worth knowing how to access this key management journal. So, how do you access HBR in full-text? The short answer is via our eJournals finder. You can find ...

Engineering problem to solve? Let Knovel help you find a solution
Did you know that Knovel provides you with more than just eBooks? Knovel is a key database for many engineering, mechanical and materials courses here at Cranfield University, and contains content from an extensive range ...

What happens when female scholars meet influential leaders?
On the 5 March 2026, our British Council Women in STEM Scholars had the privilege of sitting down with two excellent role models of industry and academia: Professor Dame Karen Holford, ...

From MSc to CEO: Igniting a research revolution
For many, a master’s degree is achieving a big milestone. Kilyan Ocampo, Computational Fluid Dynamics alumni shares how studying at Cranfield helped launch his career in the energy sector. Today, Kilyan ...