


Sourcing industry and economic data in FitchConnect
07/04/2022
")
FitchConnect users, have you tried out the data export function?
In case you don’t know… in addition to its country and industry reports, FitchConnect includes a huge data bank of macroeconomic and industry data, available for download and manipulation.
Here, to demonstrate how easy it is, we will chart the nominal GDP per capita for the last ten years plus five years of forecasts for the MINT countries: Mexico, Indonesia, Nigeria and Turkiye (Turkey). For comparison purposes we will opt to display the data in US$.
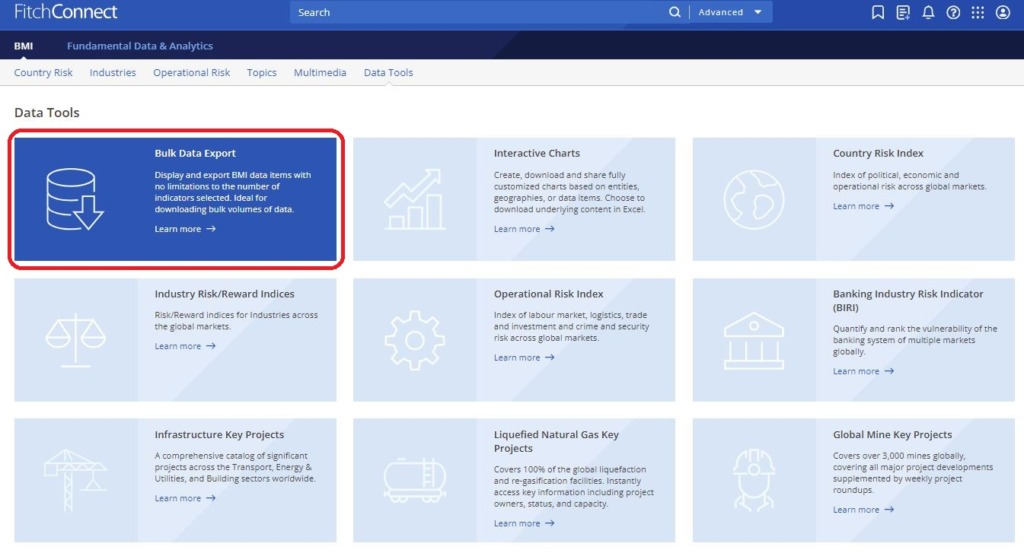
Getting started:
To begin, select the ‘Bulk Data Export’ option from the BMI > ‘Data Tools’ menu.
Selecting your data is an easy 4-step process using the options in the left hand panel.
Step 1: Select your Geographies:
Select the country or countries you require from the Geographies options. Within Geographies you can either browse by continent using the > icons or search using the ‘Filter all options’ box.
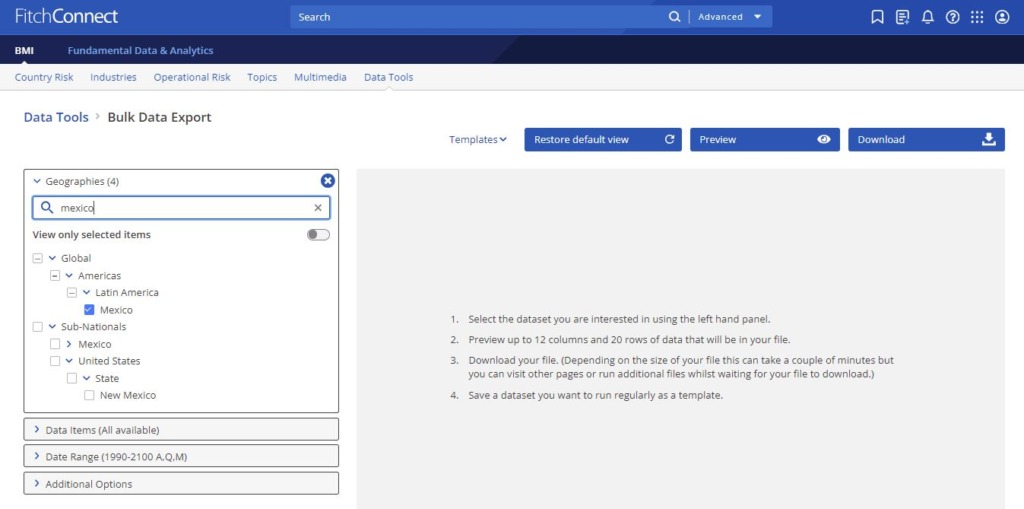
Remember to select each of the countries you require using the check-boxes before you move to the next step. The number of countries selected should be displayed next to the Geographies heading.
Step 2: Select your Data Item(s):
Now click on ‘Data Items’ to select the specific data you want to use. FitchConnect contains a databank of more than 1.6 million lines of data covering both industrial markets and macroeconomic data. For GDP, we will need the ‘Macro Economic’ menu. Open it using the > icon next to the title.
Wherever you see the > icon, you can open further sub-menus to drill further into the data. If you are unsure of where to find the data items you require, search for them using the ‘Filter all options’ box.
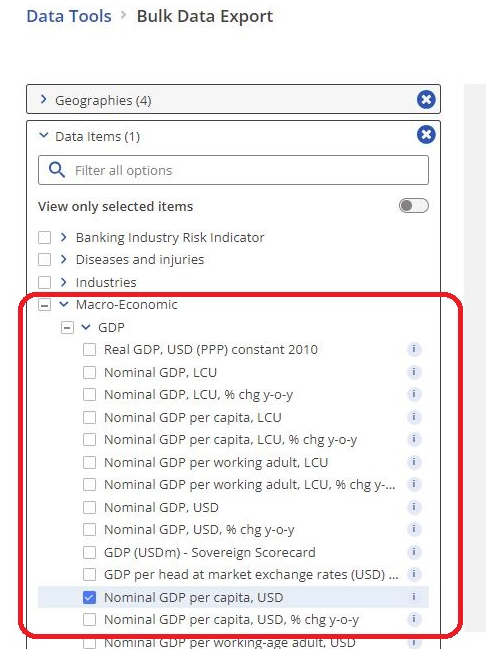
Select your dataset option(s) then scroll down to open the date range menu.
Step 3: Select Date Range:
Select your data range and frequency. Data may be reported monthly, quarterly or annually so you may have to select your preferred option. Be aware that most data is only reported on an annual basis. Depending on the datasets you have selected, your options here may vary. Where forecasts are available, Fitch will allow you to select future dates.
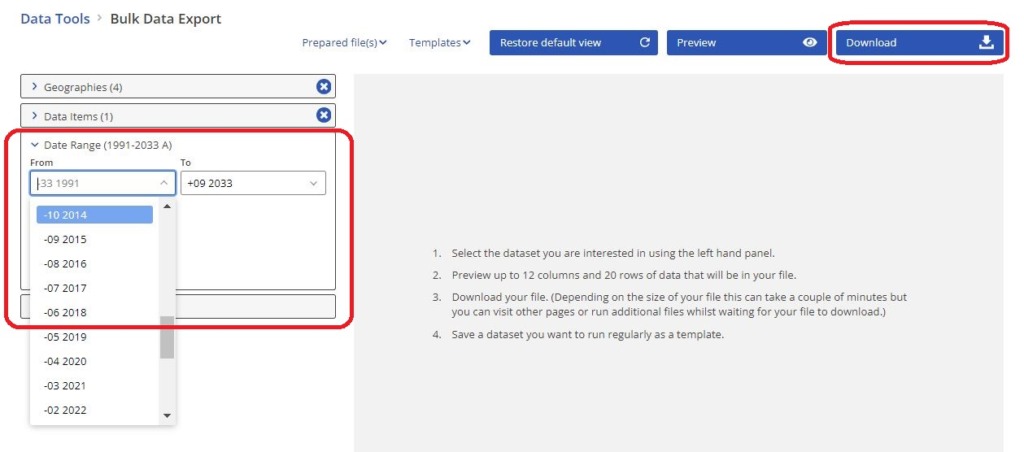
From here, you can preview your dataset or download data directly to Excel via the options at the top right.
If you are interested in downloading and charting data, you may also want to read our post on Finding economic data in Passport.
If you have any questions about downloading data or charting within our resources, feel free to contact the SOM Library
Categories & Tags:
Leave a comment on this post:
You might also like…

The Library app is back!
The Library app is back! It's exactly the same as before (although it will get a fresh look in a few months) and if you hadn't removed it from an existing device it should just ...
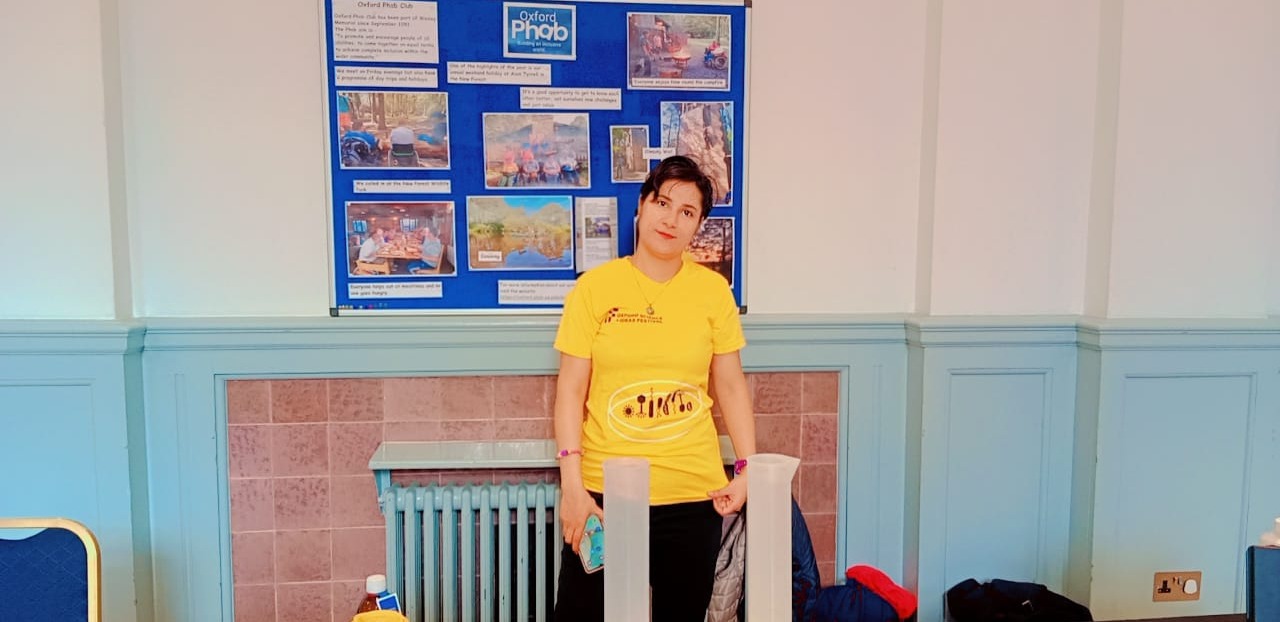
PhD researcher at the IF Oxford Science and Ideas Festival
IF Oxford is a science and ideas Festival packed with inspiring, entertaining and immersive events for people all ages. PhD researcher, Zahra attended the festival. Here she shares what motivated her to get involved. ...

What leadership skills are required to meet the demands of digitalisation?
Digital ecosystems are shifting the dynamics of the world as we know it. With digitalisation being a norm in the software industry, there is currently a rapid rise in its translation ...

My PhD experience within the Centre for Air Transport at Cranfield University
Mengyuan began her PhD in the Centre for Air Transport in October 2022. She recently shared what she is working on and how she has found studying at Cranfield University so ...
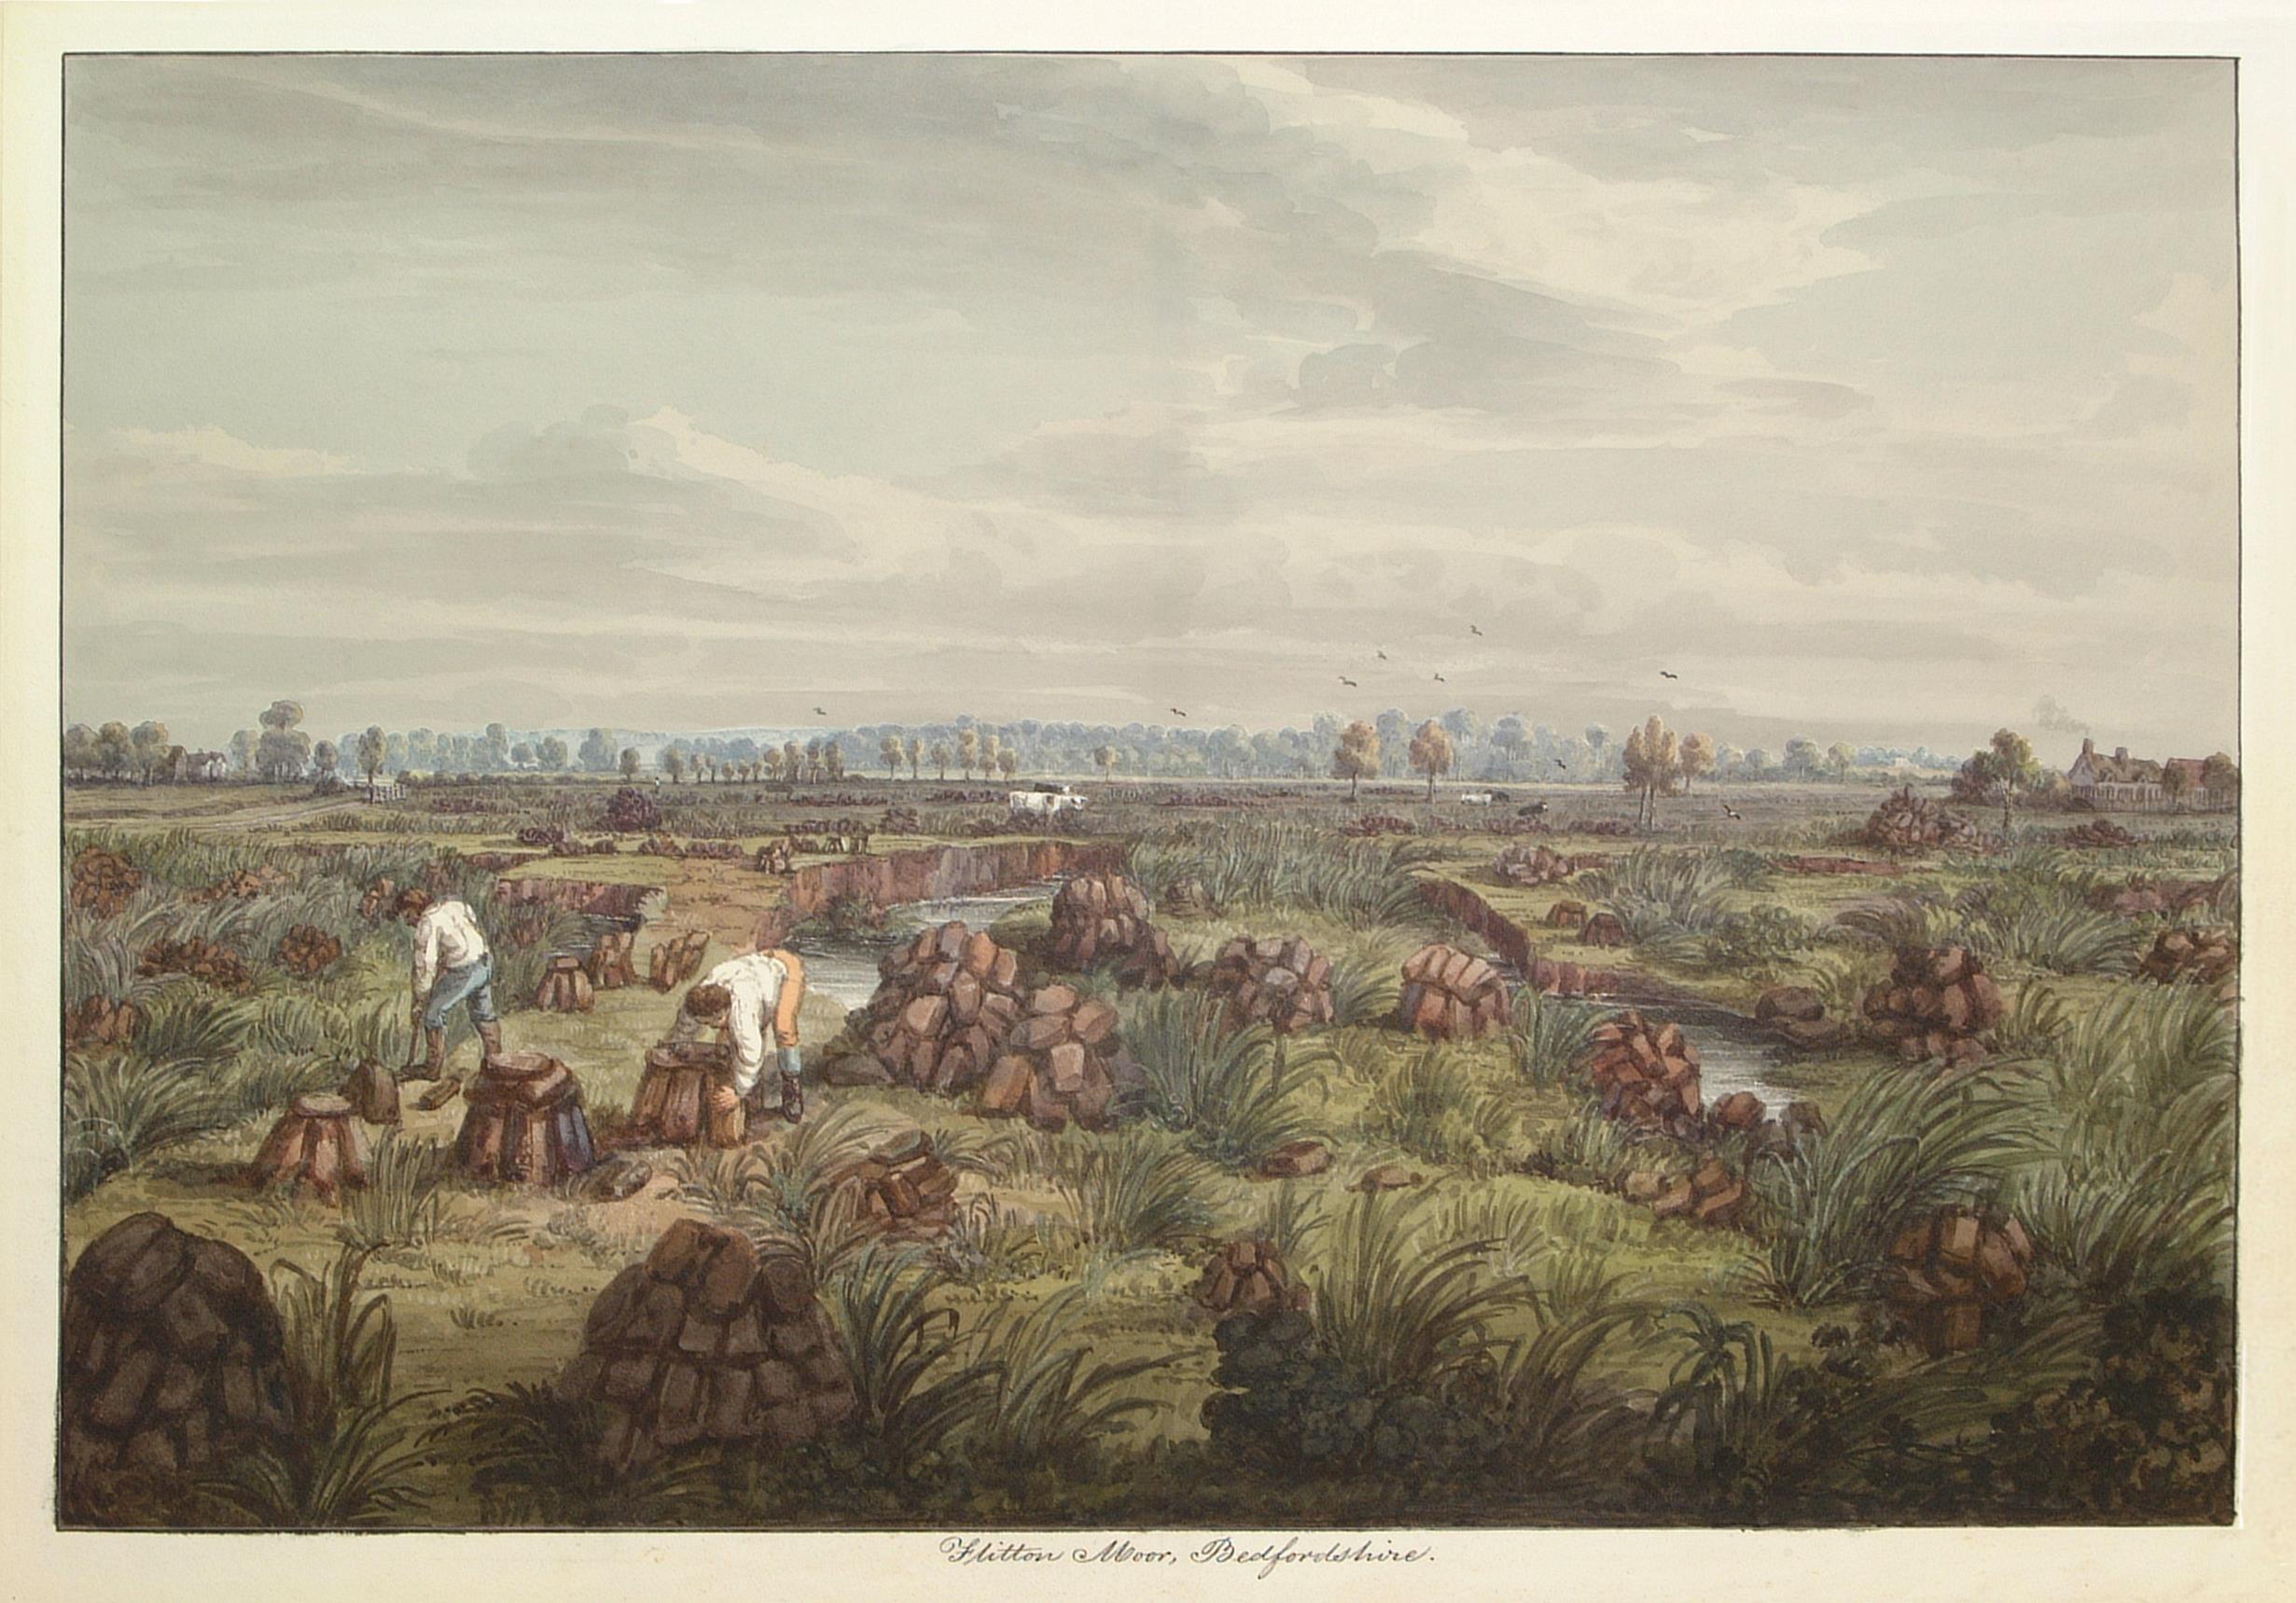
In the tyre tracks of the Edwardian geologists
In April 1905 a group of amateur geologists loaded their cumbersome bicycles on to a north-bound train at a London rail station and set off for Bedfordshire on a field excursion. In March 2024 a ...

How do I reference… images, figures, and tables in the APA7 style?
So you want to use an image or table in your assignment that you didn't create yourself - but you don't know how to cite it? Read on to find out how. Any images, figures, ...