


Media Reporting & Kindergarten Statistics
22/07/2019

The BBC reported this problem less than a week ago
It dished up the usual typical fayre of poor analysis of the available data.
When you put the data (which is published yearly back to 1996) into useful software, you get the sChart below. The data is in blue. The statistically calculated trended averages are the green lines. The upper and lower performance guidelines (outlining the performance corridor) are the red lines. The dotted red and green lines are the predictions of the performance corridor going forwards.
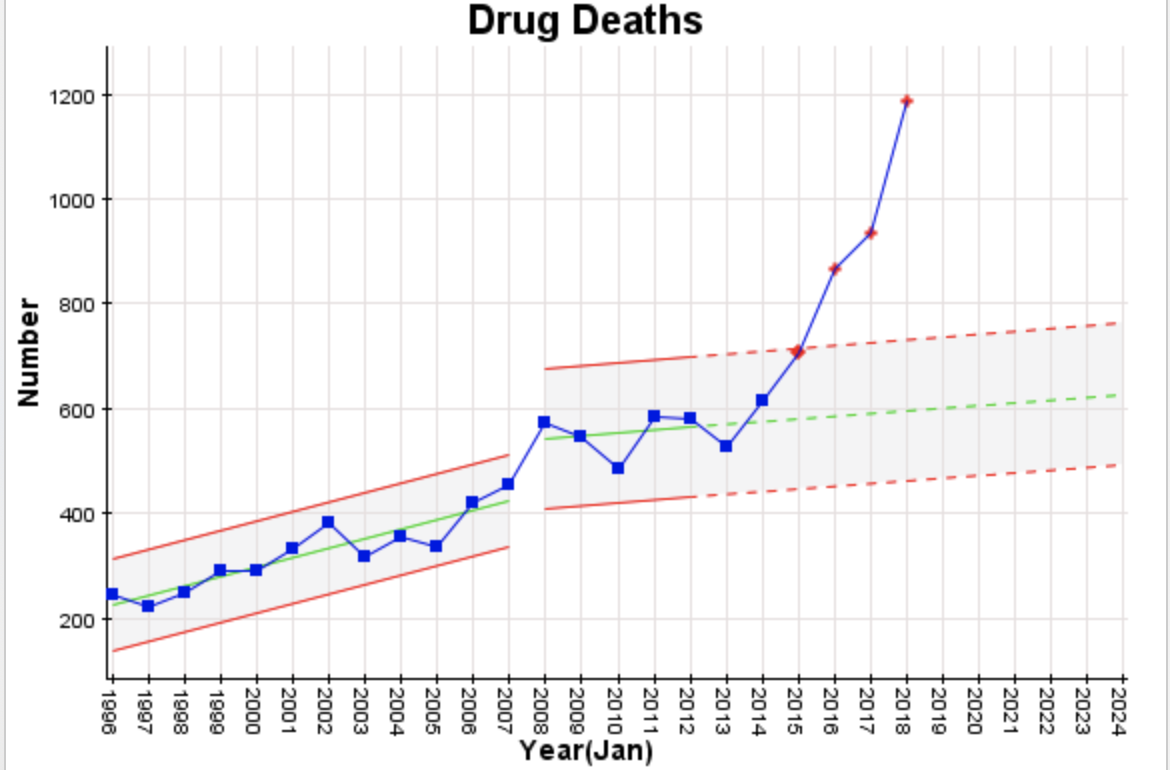
The problem started who knows how long ago with an increasing trend (of around 18 deaths per year) being set from 1996 (when we first have available data). In 2008, there was an upshift of almost 100 deaths per year but with a much reduced trend (5 – 6 per year) upwards. The first thing that comes to mind to cause the shift and the reduced trend, is the change in Scotland’s approach to drugs – see https://www.gov.scot/publications/road-recovery-new-approach-tackling-scotlands-drug-problem/pages/6/
But there could be other causes.
Things turned really nasty, though, from 2015 / 2016 onwards – so getting excited now is at least 3 – 4 years too late. Looking at the media comments / articles on this over the years it seems each year there’s noise and poor analysis about increasing drug deaths, and no preventative action, or if there is action being taken, it’s not working or possibly making things worse!
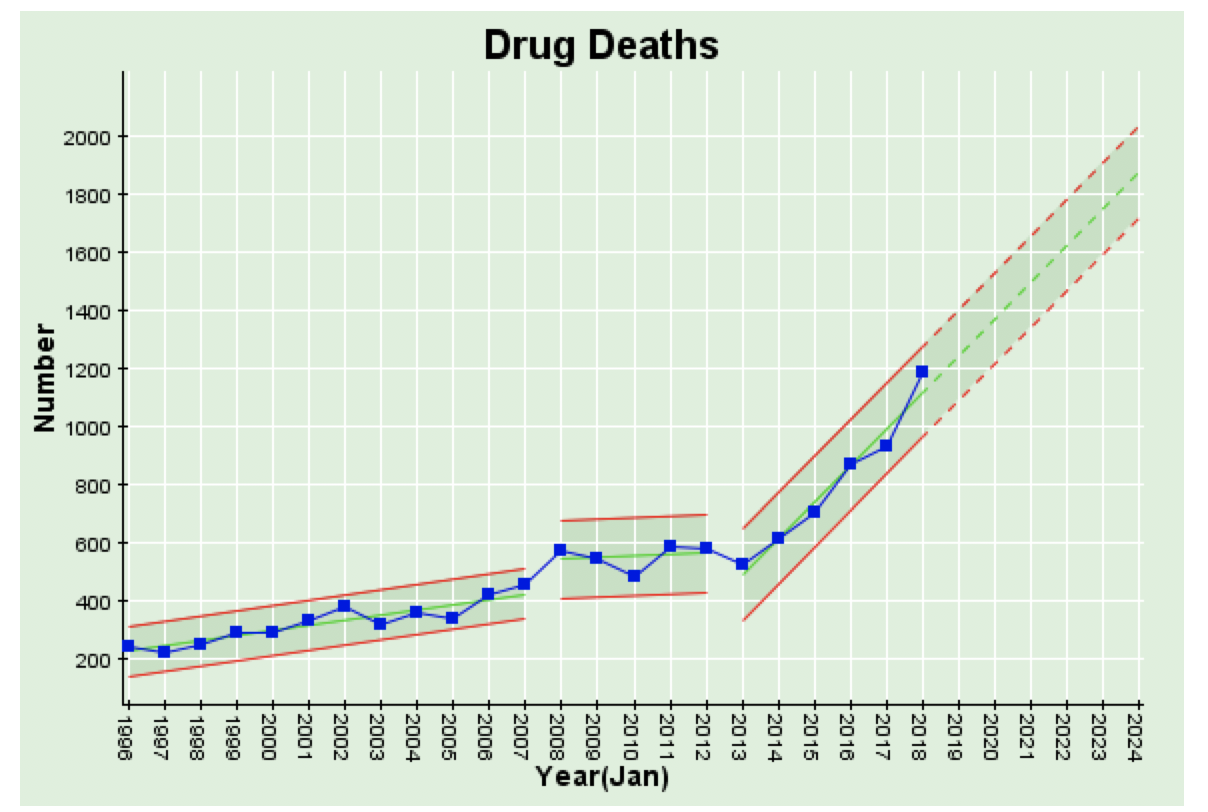
If we project the latest trend forwards by 5 years we see an increasing trend now of 126 per year! So if you think 1,200 is bad now, wait 2024 when it will be almost 2,000 per year!
To help Scotland get to the bottom of this, we might want to start with straightening out the way the BBC reports data and statistics! And let’s not wait until 2024!
Categories & Tags:
Leave a comment on this post:
You might also like…

Sustainability by royal request: Managing an event fit for a King
The Coronation of King Charles III on May 6th 2023, was watched by millions of people around the world with tens of thousands of people travelling to Central London to witness the pageantry firsthand. ...

Getting started on your Master’s thesis
Please note: This post is intended to provide advice to all students undertaking a thesis in the Schools of Aerospace, Transport and Manufacturing; Water, Energy and Environment, and Defence and Security. There is separate advice ...
Finding your tribe: “Joining the sustainability community was the best decision”
For students on Cranfield’s Sustainability Business Specialist Apprenticeship, community and camaraderie is a vital component for success. Designed in consultation with industry, the part-time Level 7 apprenticeship aims to deepen participants’ knowledge of the ...
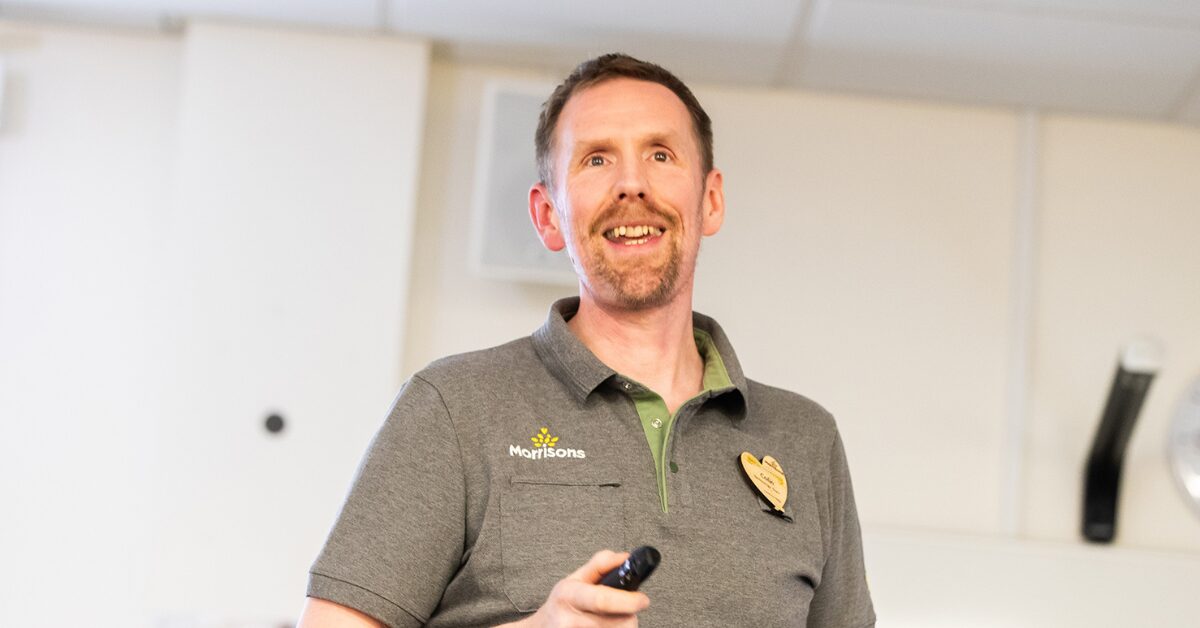
“My sustainability studies gave me the confidence to take on Amazon”
Not everyone would have the confidence to challenge a big global power like Amazon but, for Colin Featherstone, Senior Technology Manager and Tech Sustainability Lead at Morrisons, his Cranfield studies equipped him with the ...

My Apprenticeship Journey – Broadening Horizons
Laura, Senior Systems Engineer at a leading aircraft manufacturing company, joined Cranfield on the Systems Engineering Master’s Apprenticeship after initially considering taking a year off from her role to complete an MSc. Apprenticeship over MSc? ...

The Library app is back!
The Library app is back! It's exactly the same as before (although it will get a fresh look in a few months) and if you hadn't removed it from an existing device it should just ...